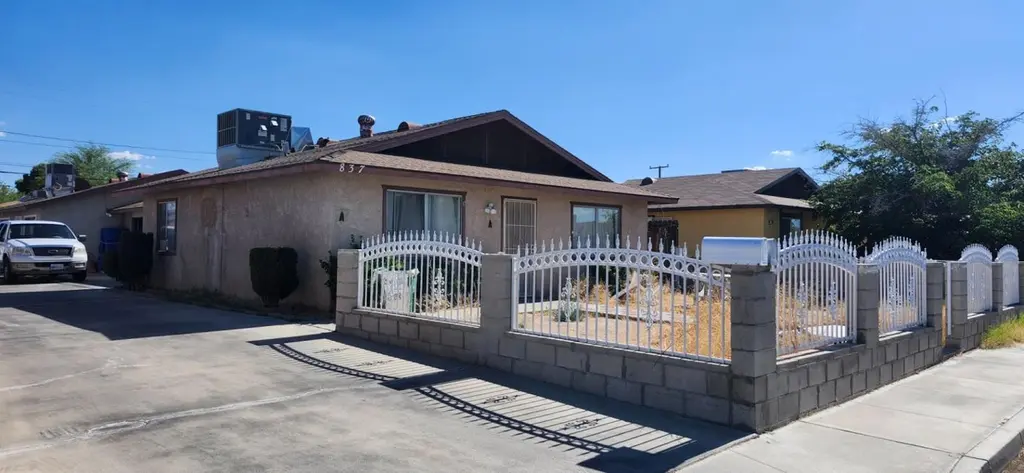
837 Commercial Ave
Ridgecrest, CA 93555
$240,000D+
3 bd · 2.0 ba ·
1,810 sqft ·
Built 1979
· MultiFamily
· Active
· 9 DOM
Cashflow @ list (25.0% down · 7.5%)
Estimated rent
$2,162/mo
Mortgage (P&I)
−$1,259
Tax + insurance
−$410
HOA
−$0
Vac / Maint / Mgmt
−$454
Net cashflow
$39/mo
Annual
$470/yr
Cap rate
6.49%
Cash-on-cash
0.70%
DSCR
1.03
1% rule
0.90%
Cash to close
$67,200
Investor read
- This is a 2 × 2-bed/1.0-bath units multifamily listed at $240k.
- At list price, monthly cash flow is $39 ($470/yr) — positive. Per door: $20/mo.
- The deal already cash-flows at list — no discount required.
- To meet the 1% rule (rent ≥ 1% of price), the offer needs to be $216k (9.9% below list).
- Only 9 days on market — expect competitive offers; lowballing is unlikely to land.
- Recommended offer: $216k (9.9% below list) — sets the bar for 1% rule.
- Local home prices are declining (-3.0%/yr); year-one equity from $2k of loan paydown is wiped out by about $7k of value loss. Plan a longer hold.
- Location reads 70/100 on livability (#243 in CA) — a middle-class / working-renter tenant base. Strengths: commute A+, housing A+; Watch: amenities D+, cost of living D+, crime F.
- Sierra Sands Unified (town): math 25% / reading 39% proficiency, ranked #294 of 517 in CA (top 57%) — families likely to look elsewhere, expect single-tenant / working-renter base with shorter leases.
- Zoned schools: Gateway Elementary (math 27% / reading 32%, grade F, #856 of 1,571 statewide, top 57%, 348 students, 47% FRL); James Monroe Middle (math 16% / reading 29%, grade F, #382 of 498 statewide, top 78%, 548 students, 49% FRL); Burroughs High (math 37% / reading 70%, grade C-, #281 of 1,170 statewide, top 24%, 1,479 students, 40% FRL) — zoned schools at 45% FRL track the district average.
- Market conditions: Rents rising (+3.6%/yr); 332 active listings in the ZIP; 16 comparable units currently listed for rent nearby; rentals leasing fast (median 5d on market — plan ~1-2 weeks tenant-placement turnaround); solid renter incomes; 3,244 units permitted in Kern County in 2024 (73 in 5+ unit buildings).
- Kern County population projected at +17% by 2050 — long-run rental-demand tailwind backs the buy-and-hold thesis.
- 3 sale attempts since 6y ago with the ask held roughly flat each time — persistent listings suggest the price (not the market) is what's stuck; bring a comps-based counter.
- Climate carrying-cost: extreme-heat days projected 7→20/yr by 2055 (HVAC capex compounding) — expect insurance premiums to compound above CPI over the hold.
- Cap rate 6.5% vs local median 4.0% in Ridgecrest — top-decile yield for the area; either an underpriced asset or a hidden risk that comps aren't pricing in. Stress-test before assuming the spread holds.
Questions for listing agent
- Can we see the unit-by-unit rent roll, current vacancy, and any below-market leases? What's the average tenancy length?
- What capital expenditures (roof, boiler, parking lot, exteriors) have been made in the last 5 years, and what's planned in the next 2?
- Built in 1979 — when were the roof, HVAC, electrical panel, plumbing, and water heater last replaced?
- Is there a deadline driving the sale (1031 exchange, divorce, estate, relocation)? That informs how much negotiation room exists.
- Crime grade is F in this area — have there been break-ins, vandalism, or insurance claims at this property in the last 3 years? What carrier currently insures it and at what premium?
- The area grade is low — what's the realistic commute time and amenity access for the typical tenant pool here? Any planned neighborhood developments (good or bad) we should know about?
- What's the average days-on-market for RENTAL listings here right now (not sales)? A rising rental-DOM trend means longer vacancies and softer asking-rent achievability than the comps imply.
- What's the recent tenant-quality profile in this submarket — average credit score on applications, eviction rate, late-payment / NSF rate, and stable-employment percentage? A property-management company in the area should have these aggregated.
CashFlowRE · CFR-PXD19K094TA6SS
· Data 23 h ago
cashflowre.app · 2026-05-29