 Duplex
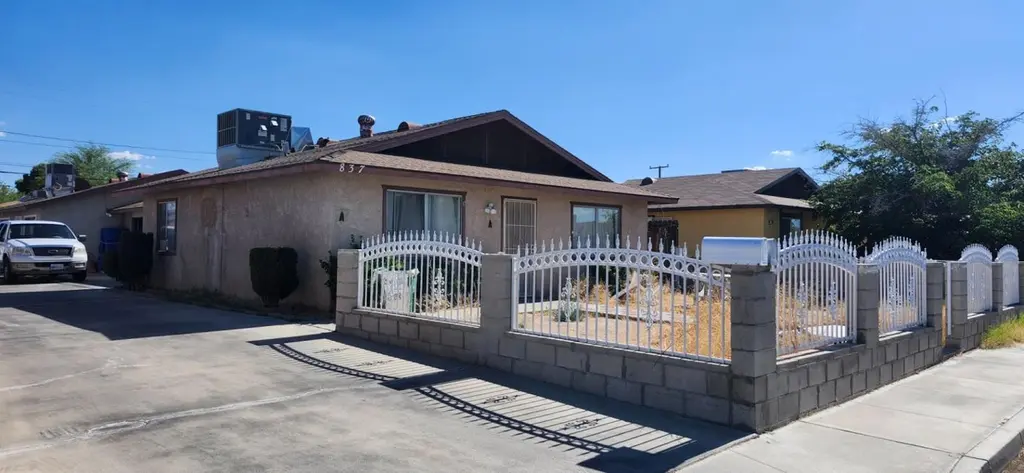
837 Commercial Ave · Ridgecrest, CA
Flood risk 1/10 · Minimal
- FEMA flood zone
- X (shaded)
- Chance of flooding over 30 yrs
- 0.0%
- Est. flood insurance / yr
- $507 – $1,088
Fire risk 3/10 · Minor
- Est. fire insurance / yr
- $659 – $1,223
Heat risk 8/10 · Major
- Hot days now (above 105°F)
- 7 days/yr
- Hot days in 30 yrs
- 20 days/yr
Wind risk 1/10 · Minimal
- Chance of severe wind over 30 yrs
- —
Air-quality risk 7/10 · Major
- Unhealthy air days now
- 14 days/yr
- Unhealthy air days in 30 yrs
- 15 days/yr
Risk factors via First Street. Map © Google.
Why this score? — see what drove the D+ grade
The composite is a weighted blend of 9 inputs, each scored 0–100. Each bar is that input's sub-score; the figure is the points it added to the 100-point composite (weight × sub-score).
- Cash flow +14.2/30.0
- ARV discount +10.5/15.0
- DSCR +4.3/10.0
- 1% rule +4.0/10.0
- Livability +3.5/5.0
- Rent growth +3.4/5.0
- Schools +2.9/10.0
- Condition / age +2.5/5.0
- Appreciation +0.0/10.0
$240,000
🖨 Deal sheet (PDF) 📄 Offer letter ✓ Due diligence
Multi-family units
County records classify this as Multi-Family (2-4 Unit). Listing-text estimate: 2 units. confirmed
Listing remarks MLS
Duplex investment opportunity conveniently located near the back gate. This property features two units with open floor plans and individual garages. Both of these units are currently rented.
Key facts
- Individual garages
- Open floor plans
- 6,534 sq ft lot
Tags
Property features AI
Finance
- Financial info: Tenant pays other expenses
Exterior
- Parking: Assigned parking spaces; Attached garage (1 garage space); 2 parking spaces minimum; carport minimum 2
- Utilities: Public water; Public sewer; Public utilities; Other separate meters
- Home design: Single-story building; One building with two units; Individual ownership
- Construction: Concrete slab foundation; Composition roof
- Exterior features: Composition roof; Concrete slab foundation; R-2 zoning; Public utilities
Interior
- Bedrooms: Unit 1: 2 bedrooms; Unit 2: 1 bedroom
- Flooring: Laminate; Vinyl/Linoleum
- Bathrooms: Unit 1: 1 full bath; Unit 2: 1 full bath
- Heating & cooling: Central forced air cooling; Floor furnace heating; Wall furnace heating
- Interior features: Laminate and vinyl/linoleum flooring; Other special features (see remarks); Two separate units in the building
Neighborhood map
What this means for you Summary
Snapshot
- This is a 2 × 2-bed/1.0-bath units multifamily listed at $240k.
Deal economics
- At list price, monthly cash flow is $39 ($470/yr) — positive. Per door: $20/mo.
- The deal already cash-flows at list — no discount required.
- To meet the 1% rule (rent ≥ 1% of price), the offer needs to be $216k (9.9% below list).
- Recommended offer: $216k (9.9% below list) — sets the bar for 1% rule.
- Cap rate 6.5% vs local median 4.0% in Ridgecrest — top-decile yield for the area; either an underpriced asset or a hidden risk that comps aren't pricing in. Stress-test before assuming the spread holds.
Location & tenants
- Location reads 70/100 on livability (#243 in CA) — a middle-class / working-renter tenant base. Strengths: commute A+, housing A+; Watch: amenities D+, cost of living D+, crime F.
- Sierra Sands Unified (town): math 25% / reading 39% proficiency, ranked #294 of 517 in CA (top 57%) — families likely to look elsewhere, expect single-tenant / working-renter base with shorter leases.
- Zoned schools: Gateway Elementary (math 27% / reading 32%, grade F, #856 of 1,571 statewide, top 57%, 348 students, 47% FRL); James Monroe Middle (math 16% / reading 29%, grade F, #382 of 498 statewide, top 78%, 548 students, 49% FRL); Burroughs High (math 37% / reading 70%, grade C-, #281 of 1,170 statewide, top 24%, 1,479 students, 40% FRL) — zoned schools at 45% FRL track the district average.
- Market conditions: Rents rising (+3.6%/yr); 332 active listings in the ZIP; 16 comparable units currently listed for rent nearby; rentals leasing fast (median 5d on market — plan ~1-2 weeks tenant-placement turnaround); solid renter incomes; 3,244 units permitted in Kern County in 2024 (73 in 5+ unit buildings).
Forward outlook
- Local home prices are declining (-3.0%/yr); year-one equity from $2k of loan paydown is wiped out by about $7k of value loss. Plan a longer hold.
- Kern County population projected at +17% by 2050 — long-run rental-demand tailwind backs the buy-and-hold thesis.
Negotiation context
- Only 9 days on market — expect competitive offers; lowballing is unlikely to land.
- 3 sale attempts since 6y ago with the ask held roughly flat each time — persistent listings suggest the price (not the market) is what's stuck; bring a comps-based counter.
Risks & watch-outs
- Climate carrying-cost: extreme-heat days projected 7→20/yr by 2055 (HVAC capex compounding) — expect insurance premiums to compound above CPI over the hold.
Questions for the listing agent
- Can we see the unit-by-unit rent roll, current vacancy, and any below-market leases? What's the average tenancy length?
- What capital expenditures (roof, boiler, parking lot, exteriors) have been made in the last 5 years, and what's planned in the next 2?
- Built in 1979 — when were the roof, HVAC, electrical panel, plumbing, and water heater last replaced?
- Is there a deadline driving the sale (1031 exchange, divorce, estate, relocation)? That informs how much negotiation room exists.
- Crime grade is F in this area — have there been break-ins, vandalism, or insurance claims at this property in the last 3 years? What carrier currently insures it and at what premium?
- The area grade is low — what's the realistic commute time and amenity access for the typical tenant pool here? Any planned neighborhood developments (good or bad) we should know about?
- What's the average days-on-market for RENTAL listings here right now (not sales)? A rising rental-DOM trend means longer vacancies and softer asking-rent achievability than the comps imply.
- What's the recent tenant-quality profile in this submarket — average credit score on applications, eviction rate, late-payment / NSF rate, and stable-employment percentage? A property-management company in the area should have these aggregated.
- How much new apartment / multifamily construction is in the pipeline within 1–3 miles? Heavy new supply (>2% of stock underway) typically softens rents 12–24 months out; light construction supports rent growth.
Investment metrics
- 1% rule
- 0.90% ✗
- Cap rate
- 6.49%
- Cash-on-cash
- 0.70%
- DSCR
- 1.03
- GRM
- 9.3
CMA / ARV
- ARV (on-the-fly)
- $257,020
- Comps found
- 3
Show comp detail 3 sales within ~0.75 mi
| Address | Dist | Beds/Ba | Sqft | Sold | Price | $/sf | Match |
|---|---|---|---|---|---|---|---|
| 645 Commercial Ave | 0.22mi | 4/2.0 (+1) | 1,798 (-1%) | 5mo | $280,000 | $156 | 79 |
| 112 Valley St | 0.17mi | 4/2.0 (+1) | 1,952 (+8%) | 6mo | $215,000 | $110 | 69 |
| 217 S Gold Canyon St | 0.72mi | 4/2.0 (+1) | 1,624 (-10%) | 23mo | $230,000 | $142 | 25 |
Match score weights: distance 35% · size 25% · config 20% · recency 20%. Top-matched comps best support the ARV.
Projected returns pro-forma
-3.0% appreciation · 3.58% rent growth · sell at horizon
- IRR
- -14.5%
- Equity multiple
- 0.48×
- Total profit
- $-35,087
- Equity at exit
- $35,785
- IRR
- -4.8%
- Equity multiple
- 0.67×
- Total profit
- $-21,914
- Equity at exit
- $20,751
Cash invested: $67,200 (down + closing). Projections, not guarantees.
Landlord ↔ Tenant lean methodology
- Overall (STATE)
- 18 Strongly Tenant-Friendly
- State California
- 18 Strongly Tenant-Friendly · D+13
- County
- — inherits STATE
- City
- — inherits STATE
ZIP-level market 93555
- Home prices YoY
- -24.0%
- Rents YoY
- 3.6%
- Active inventory
- 332
- Price-to-rent
- 18.5×
Monthly cashflow live
- Estimated rent
- $2,162 high interval (Pro) →
- Mortgage (P&I)
- −$1,259
- Tax from tax record
- −$310 /mo · $3,723/yr
- Insurance
- −$100
- HOA
- −$0
- Vacancy / Maint / Mgmt
- −$454
- Net cashflow
- $39
Break-even live
Sensitivity live
| Price | -10% $175 | -5% $107 | +0% $39 | +5% $-29 | +10% $-97 |
|---|---|---|---|---|---|
| Rent | -10% $-132 | -5% $-46 | +0% $39 | +5% $125 | +10% $210 |
| Rate | -1.0pp $160 | -0.5pp $100 | base $39 | +0.5pp $-23 | +1.0pp $-86 |
2-unit breakdown (identical units grouped — click to expand)
| Units | Beds | Baths | Est. rent |
|---|---|---|---|
| 2× units | 2 | 1 | $2,162 |
| #1 | 2 | 1 | $1,081 |
| #2 | 2 | 1 | $1,081 |
| Total (2 units) | $2,162 | ||
UW: 25.0% down · 7.5% · 30yr · 1.5% tax · 5.0% vac · 8.0% maint · 8.0% mgmt
Financing live
Cash to close
- Down payment
- $60,000
- Closing costs
- $7,200
- Reserves months
- —
- Total cash needed
- —
Loan-product check · same deal, 3 products live
Conventional
25% down · 7.5% · 30yr
- Down + closing
- —
- Monthly P&I
- —
- Monthly cashflow
- —
- DSCR
- —
- Eligible?
- —
Personal DTI + credit; lowest rate.
DSCR
20% down · 8.5% · 30yr
- Down + closing
- —
- Monthly P&I
- —
- Monthly cashflow
- —
- DSCR
- —
- Eligible?
- —
No personal income docs; deal must DSCR.
Hard money
10% down · 12.0% · 12mo
- Down + closing
- —
- Monthly P&I
- —
- Monthly cashflow
- —
- DSCR
- —
- Eligible?
- —
Short-term bridge; refi at stabilization.
Rent comps 16 comps
| Address | Beds | Baths | Sqft | Rent | $/sqft | DOM | Units | Dist |
|---|---|---|---|---|---|---|---|---|
| 236 S American St Ridgecrest, CA | 3.0 | 2.0 | 1407 | $1,650 | $1.17 | 45d | 1 | 0.30mi |
| 629 Beth Ln Ridgecrest, CA | 4.0 | 2.0 | 1629 | $1,900 | $1.17 | 21d | 1 | 0.34mi |
| 112 Rawhide Ln Ridgecrest, CA | 3.0 | 2.0 | 1467 | $1,650 | $1.12 | 4d | 1 | 0.35mi |
| 224 Larkspur St Ridgecrest, CA | 3.0 | 2.0 | 1362 | $1,995 | $1.46 | 4d | 1 | 0.39mi |
| 624 Yellow Astor Ave Ridgecrest, CA | 2.0 | 2.0 | 1441 | $1,800 | $1.25 | 23d | 1 | 0.42mi |
| 528 Heatherglen Dr Ridgecrest, CA | 3.0 | 2.0 | 1370 | $1,725 | $1.26 | 4d | 1 | 0.48mi |
| 431 Jacobs Ct Ridgecrest, CA | 3.0 | 2.0 | 1743 | $1,850 | $1.06 | 45d | 1 | 0.56mi |
| 442 S Desert Candles St Ridgecrest, CA | 4.0 | 2.0 | 1753 | $1,850 | $1.06 | 46d | 1 | 0.68mi |
| 528 S Sorrel St Ridgecrest, CA | 4.0 | 2.0 | 1656 | $1,850 | $1.12 | 4d | 1 | 0.82mi |
| 520 Silveridge St Ridgecrest, CA | 3.0 | 2.0 | 1471 | $2,000 | $1.36 | 45d | 1 | 0.84mi |
| 255 E Upjohn Ave Ridgecrest, CA | 2.0 | 2.5 | 1258 | $1,350 | $1.07 | 4d | 1 | 0.85mi |
| 247 E Upjohn Ave Ridgecrest, CA | 3.0 | 2.5 | 1305 | $1,425 | $1.09 | 4d | 1 | 0.86mi |
| 205 E Upjohn Ave Ridgecrest, CA | 2.0 | 2.5 | 1288 | $1,225 | $0.95 | 45d | 1 | 0.88mi |
| 506 S Alvord St Ridgecrest, CA | 4.0 | 2.0 | 1971 | $1,800 | $0.91 | 5d | 1 | 1.32mi |
| 225 N Helena St Ridgecrest, CA | 3.0 | 2.0 | 1527 | $1,750 | $1.15 | 4d | 1 | 1.37mi |
| 419 Jean Ave Ridgecrest, CA | 3.0 | 2.0 | 1583 | $1,585 | $1.00 | 4d | 1 | 1.38mi |
Listing history 8 events
-
2026-06-21days on market $240,000 Active 9 DOM
-
2026-06-18days on market $240,000 Active 6 DOM
-
2026-06-17price $240,000 Active 5 DOM
-
2026-06-17days on market $250,000 Active 5 DOM
-
2026-06-16days on market $250,000 Active 4 DOM
-
2026-06-15days on market $250,000 Active 3 DOM
-
2026-06-13remarks 191-char remark
-
2026-06-13$250,000 Active 1 DOM
ⓘ Source: listings_history table (triggers on properties + properties_extension) + one-shot
backfill from property_details.listing_events for pre-trigger history.
Tax reassessment forecast CA · Resets to sale price
- Current annual tax
- $3,723 · $310/mo
- Projected year-2 tax
- $3,723 · $310/mo
- Expected delta
- $0/yr ($0/mo · 0.0%)
ⓘ Screening estimate from a state-policy table — verify with the county assessor before closing.
Climate risk First Street
- Flood 1/10 Low FEMA zone X (shaded) · 0% chance over 30 yrs
- Wildfire 3/10 Moderate
- Heat 8/10 Severe 7 d/yr ≥105°F today · 20 d/yr by 30 yrs out
- Wind 1/10 Low
- Air quality 7/10 Severe 14 unhealthy d/yr today · 15 by 30 yrs out
Nearby sold comps map
Loading sold comps map…
Walkable amenities ~0.75 mi
Loading nearby amenities…
Taxation est. · year 1
- Rental income
- $25,944
- − Mortgage interest
- −$13,444
- − Property taxes
- −$3,723
- − Insurance
- −$1,200
- − Repairs & maintenance
- −$2,076
- − Management
- −$2,076
- − Depreciation
- −$6,982
- Taxable loss
- −$3,555
- Est. tax savings @ 24.0%
- +$853
- After-tax cash flow
- $1,323/yr
For passive investors: Depreciation is non-cash, so a rental often shows a tax loss while cash-flowing — sheltering income. Rental losses are passive: they offset passive income freely, and up to $25,000/yr can offset ordinary (W-2) income if you actively participate and your MAGI is under $100k (phasing out to $0 by $150k); unused losses carry forward. On sale, claimed depreciation is recaptured at up to 25%, and gains may owe capital-gains tax (a 1031 exchange can defer both). Figures are a year-1 estimate at your 24.0% rate — not tax advice; consult a CPA.
Schools (NCES district)
- District
- Sierra Sands Unified
- NCES district ID
- 0636800
- Math proficiency
- 25% ▼ -11.00%
- Reading proficiency
- 39% ▼ -11.00%
- Median HH income
- $58,937
- Composite
- 28.66/100
- National rank
- #6699
- State rank
- #294 of 517 in CA
Livability — Ridgecrest
- Score
- 70/100
- State rank
- #243
- US rank
- #8014
Category grades
Schools grade is shown separately in the Schools card above.
Census & demographics
- Census place
- Ridgecrest, CA
- County
- Kern County · 710,371 people
- City population
- 33,845
- Metro
- Bakersfield, CA
- Population (ZIP)
- 33,845
- Household income
- $86,700
- Rent vs Own
- Severe rent burden
- 975.0
Population outlook (Kern County) Hauer SSP2
- Today (2025)
- 947,286 people
- By 2030
- 978,984 · +3.3%
- By 2040
- 1,045,018 · +10.3%
- By 2050
- 1,105,232 · +16.7%
- By 2075
- 1,229,538 · +29.8%
- By 2100
- 1,238,059 · +30.7%
Race, ethnicity, and origin ACS 2023
- Neighborhood character
- Majority White (65%)
- Race & ethnicity
- White 65% Hispanic / Latino 20% Two or more races 12% Black 4% Asian 4% Native American 1%
- Hispanic origin (detail)
- Mexican 15%
- Common ancestry
- Italian 4% Lithuanian 2% Slovak 2%
- Foreign-born
- 7% · Canada
- Languages at home
- 84% English-only · Spanish 11% Other Indo-European 1% Other Asian/Pacific 1%
Political lean MEDSL · Kern
- 2024 margin
- Strong R (+21.1) · D 38.2% · R 59.3% · Other 2.5%
- 2008→2024 swing
- -3.3pp toward R · 2008: -17.8pp · 2024: -21.1pp
- All cycles
- 2024: R+21.1 2020: R+10.2 2016: R+15.0 2012: R+20.9 2008: R+17.8
Not yet ingested
- Civics
- —
Market trends
- HPI YoY
- ▼ -120.17%
- Current HPI
- 380.5208
- Rent YoY
- ▲ 3.58%
- Metro
- Bakersfield, CA
- State GDP YoY
- ▲ 3.21%
- F500 in state
- 116
Industry mix (Fortune 500 HQ in CA)
| Industry | F500 HQs | Revenue |
|---|---|---|
| Technology | 27 | $1,492B |
|
||
| Financial Services | 3 | $174B |
|
||
| Retail | 3 | $44B |
|
||
| Insurance | 3 | $26B |
|
||
| Media / Entertainment | 2 | $115B |
|
||
| Pharmaceuticals / Biotech | 2 | $62B |
|
||
Price history
+1288.9% since first listed10 events — show timeline
- 2026-06-12 Listed $250,000 MLSListings
- 2026-06-12 Listed $250,000 bridgeMLS, Bay East AOR, or Contra Costa AOR
- 2025-06-30 Sold (Public Records) $250,000 Public Records
- 2022-06-10 Price Changed $850 RENT.
- 2021-05-14 Sold (Public Records) $215,000 Public Records
- 2021-05-14 Sold (MLS) $215,000 SSMLS
- 2020-10-16 Listed $229,000 SSMLS
- 2008-07-11 Sold (Public Records) $125,000 Public Records
- 2007-03-16 Sold (Public Records) $200,000 Public Records
- 1981-04-24 Sold (Public Records) $18,000 Public Records
Property tax history
+10.1%/yrLatest (2025): $3,723 · +5.4% YoY. Source: county tax records.
Cash-flow waterfall
monthlySold comps — $/sqft
last 12 mo · ≤1 miLoading sold comps…