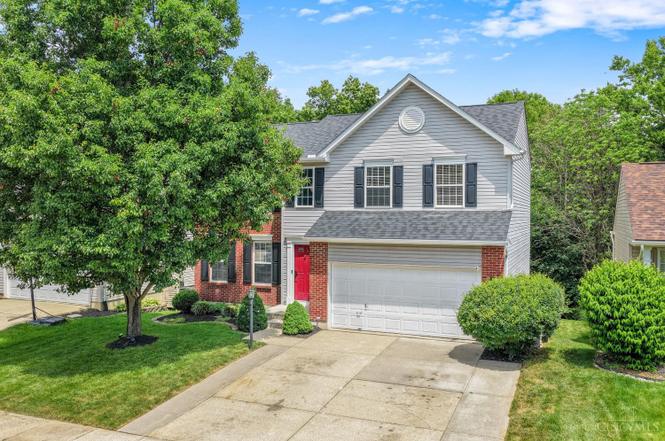
5637 Appaloosa Cir
Morrow, OH 45152
$405,000B+
4 bd · 2.5 ba ·
2,790 sqft ·
Built 2002
· SingleFamily
· Active
· 6 DOM
Cashflow @ list (25.0% down · 7.5%)
Estimated rent
$5,995/mo
Mortgage (P&I)
−$2,124
Tax + insurance
−$566
HOA
−$27
Vac / Maint / Mgmt
−$1,259
Net cashflow
$2,019/mo
Annual
$24,231/yr
Cap rate
12.28%
Cash-on-cash
21.37%
DSCR
1.95
1% rule
1.48%
Cash to close
$113,400
Investor read
- This is a 4-bed/2.5-bath single-family listed at $405k.
- At list price, monthly cash flow is $2k ($24k/yr) — positive.
- The deal already cash-flows at list — no discount required.
- Meets the 1% rule at list price ($6k rent vs $405k).
- Only 6 days on market — expect competitive offers; lowballing is unlikely to land.
- Local home prices are declining (-3.0%/yr); year-one equity from $3k of loan paydown is wiped out by about $12k of value loss. Plan a longer hold.
- Location reads 75/100 on livability (#266 in OH, #4,231 nationally) — a middle-class / working-renter tenant base. Strengths: crime A+, cost of living A+, housing A+; Watch: amenities F, commute F.
- Little Miami Local (rural): math 67% / reading 70% proficiency, ranked #140 of 656 in OH (top 21%) — acceptable for families but not a draw, mixed tenant base, ~2y average lease; only 17% free/reduced lunch — higher-income household profile.
- Zoned schools: Little Miami Primary School (math 76% / reading 65%, grade A-, #376 of 1,584 statewide, top 24%, 855 students, 18% FRL); Little Miami Middle School (math 67% / reading 72%, grade A, #143 of 654 statewide, top 23%, 1,279 students, 16% FRL); Little Miami High School (math 52% / reading 81%, grade B, #150 of 781 statewide, top 20%, 1,445 students, 14% FRL) — zoned schools at 16% FRL track the district average.
- Market conditions: 127 active listings in the ZIP; 1 comparable units currently listed for rent nearby; high-income renter base; 1,224 units permitted in Warren County in 2024 (474 in 5+ unit buildings).
- Warren County population projected at +16% by 2050 — long-run rental-demand tailwind backs the buy-and-hold thesis.
- 3 sale attempts since 15y ago with the ask held roughly flat each time — persistent listings suggest the price (not the market) is what's stuck; bring a comps-based counter.
- Current owner paid $155k; list at $405k implies a 161% gain — meaningful room to come down on a strong offer.
- At projected returns (-3.0% appreciation + 3.0% rent growth), your $113k cash investment doubles in ~6 years — after that, you're playing with house money.
- Cap rate 12.3% vs local median 3.9% in Morrow — top-decile yield for the area; either an underpriced asset or a hidden risk that comps aren't pricing in. Stress-test before assuming the spread holds.
- At $5,995/mo this rent would consume 60% of the median local household income ($120k/yr) — very limited rent-growth headroom before tenants either downsize or default.
Questions for listing agent
- What does the HOA fee cover, when was the last increase, and are there any pending special assessments or reserve-fund shortfalls?
- Is there a deadline driving the sale (1031 exchange, divorce, estate, relocation)? That informs how much negotiation room exists.
- Schools are B-rated — typically a magnet for longer-tenancy family renters. What's the average tenant stay here, and is there a school-zone premium baked into asking?
- What's the average days-on-market for RENTAL listings here right now (not sales)? A rising rental-DOM trend means longer vacancies and softer asking-rent achievability than the comps imply.
- What's the recent tenant-quality profile in this submarket — average credit score on applications, eviction rate, late-payment / NSF rate, and stable-employment percentage? A property-management company in the area should have these aggregated.
- How much new for-sale + rental construction is in the pipeline within 1–3 miles? Heavy new supply typically softens prices + rents 12–24 months out; constrained supply supports both.
CashFlowRE · CFR-PXJJ6H9ET1ZEQW
· Data 1 day ago
cashflowre.app · 2026-05-29