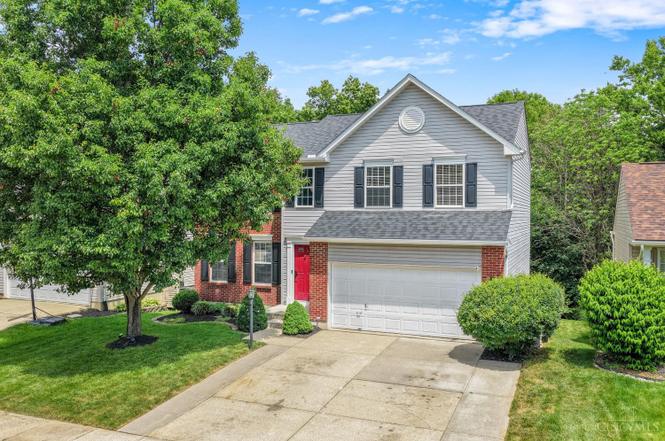
5637 Appaloosa Cir · Morrow, OH
Flood risk 1/10 · Minimal
- FEMA flood zone
- X (unshaded)
- Chance of flooding over 30 yrs
- 0.0%
- Est. flood insurance / yr
- $473 – $860
Fire risk 1/10 · Minimal
- Est. fire insurance / yr
- $713 – $1,323
Heat risk 4/10 · Minor
- Hot days now (above 101°F)
- 7 days/yr
- Hot days in 30 yrs
- 19 days/yr
Wind risk 2/10 · Minimal
- Chance of severe wind over 30 yrs
- 1.0%
Air-quality risk 4/10 · Minor
- Unhealthy air days now
- 4 days/yr
- Unhealthy air days in 30 yrs
- 6 days/yr
Risk factors via First Street. Map © Google.
Why this score? — see what drove the B+ grade
The composite is a weighted blend of 9 inputs, each scored 0–100. Each bar is that input's sub-score; the figure is the points it added to the 100-point composite (weight × sub-score).
- Cash flow +30.0/30.0
- ARV discount +10.9/15.0
- DSCR +10.0/10.0
- 1% rule +9.8/10.0
- Schools +6.1/10.0
- Livability +3.8/5.0
- Rent growth +2.5/5.0
- Condition / age +2.5/5.0
- Appreciation +0.0/10.0
$405,000
🖨 Deal sheet (PDF) 📄 Offer letter ✓ Due diligence
Listing remarks MLS
Loaded w/extras! Widened driveway, finshd W/O bsmnt w/wet bar, half ba & tons of storage. 4'bumpout in fmly rm, deck & patio ovrlooking xtra lrg wooded lot near cmmnty playground. W/I walking dist of Loveland biketrail & dogprk. Lease Avlbl
Key facts
- 9,222 sq ft lot
- 2 garage spots
- Built 2002
Property features AI
Finance
- HOA & community: HOA with an annual fee of $325 covering the play area
Exterior
- Parking: Attached garage with 2 spaces; Driveway
- Utilities: Public water; Public sewer; Natural gas; Gas water heater; Electric service (standard)
- Home design: Traditional single-family home; Three or more levels; Poured foundation
- Construction: Brick and vinyl siding exterior; Shingle roof
- Exterior features: Covered deck/patio; Deck; Patio; Fire pit; Hot tub; Invisible fencing
Interior
- Kitchen: Kitchen features pantry and marble/granite/ slate countertops
- Bedrooms: 4 bedrooms total; Primary bedroom about 14 x 21 (level 2); Bedroom 2 about 11 x 12 (level 2); Bedroom 3 about 11 x 12 (level 2); Bedroom 4 about 12 x 15 (level 2)
- Flooring: Laminate flooring in the living/great room
- Bathrooms: 2 full bathrooms; 2 half bathrooms; A bathroom is located on the first level (partial)
- Heating & cooling: Forced air heating; Central air conditioning
- Interior features: 12 total rooms; Full walkout basement; 4-season room
- Laundry & utility: Laundry room about 11 x 12 (basement)
Neighborhood map
What this means for you Summary
Snapshot
- This is a 4-bed/2.5-bath single-family listed at $405k.
Deal economics
- At list price, monthly cash flow is $2k ($24k/yr) — positive.
- The deal already cash-flows at list — no discount required.
- Meets the 1% rule at list price ($6k rent vs $405k).
- Cap rate 12.3% vs local median 4.0% in Morrow — top-decile yield for the area; either an underpriced asset or a hidden risk that comps aren't pricing in. Stress-test before assuming the spread holds.
Location & tenants
- Location reads 75/100 on livability (#266 in OH, #4,231 nationally) — a middle-class / working-renter tenant base. Strengths: crime A+, cost of living A+, housing A+; Watch: amenities F, commute F.
- Little Miami Local (rural): math 67% / reading 70% proficiency, ranked #140 of 656 in OH (top 21%) — acceptable for families but not a draw, mixed tenant base, ~2y average lease; only 17% free/reduced lunch — higher-income household profile.
- Zoned schools: Little Miami Primary School (math 76% / reading 65%, grade A-, #376 of 1,584 statewide, top 24%, 855 students, 18% FRL); Little Miami Middle School (math 67% / reading 72%, grade A, #143 of 654 statewide, top 23%, 1,279 students, 16% FRL); Little Miami High School (math 52% / reading 81%, grade B, #150 of 781 statewide, top 20%, 1,445 students, 14% FRL) — zoned schools at 16% FRL track the district average.
- Market conditions: 127 active listings in the ZIP; 1 comparable units currently listed for rent nearby; high-income renter base; 1,224 units permitted in Warren County in 2024 (474 in 5+ unit buildings).
- At $5,995/mo this rent would consume 60% of the median local household income ($120k/yr) — very limited rent-growth headroom before tenants either downsize or default.
Forward outlook
- Local home prices are declining (-3.0%/yr); year-one equity from $3k of loan paydown is wiped out by about $12k of value loss. Plan a longer hold.
- Warren County population projected at +16% by 2050 — long-run rental-demand tailwind backs the buy-and-hold thesis.
- At projected returns (-3.0% appreciation + 3.0% rent growth), your $113k cash investment doubles in ~6 years — after that, you're playing with house money.
Negotiation context
- Only 6 days on market — expect competitive offers; lowballing is unlikely to land.
- 3 sale attempts since 15y ago with the ask held roughly flat each time — persistent listings suggest the price (not the market) is what's stuck; bring a comps-based counter.
- Current owner paid $155k; list at $405k implies a 161% gain — meaningful room to come down on a strong offer.
Questions for the listing agent
- What does the HOA fee cover, when was the last increase, and are there any pending special assessments or reserve-fund shortfalls?
- Is there a deadline driving the sale (1031 exchange, divorce, estate, relocation)? That informs how much negotiation room exists.
- Schools are B-rated — typically a magnet for longer-tenancy family renters. What's the average tenant stay here, and is there a school-zone premium baked into asking?
- What's the average days-on-market for RENTAL listings here right now (not sales)? A rising rental-DOM trend means longer vacancies and softer asking-rent achievability than the comps imply.
- What's the recent tenant-quality profile in this submarket — average credit score on applications, eviction rate, late-payment / NSF rate, and stable-employment percentage? A property-management company in the area should have these aggregated.
- How much new for-sale + rental construction is in the pipeline within 1–3 miles? Heavy new supply typically softens prices + rents 12–24 months out; constrained supply supports both.
Investment metrics
- 1% rule
- 1.48% ✓
- Cap rate
- 12.28%
- Cash-on-cash
- 21.37%
- DSCR
- 1.95
- GRM
- 5.6
CMA / ARV
- ARV (on-the-fly)
- $438,030
- Comps found
- 12
Show comp detail 12 sales within ~0.75 mi
| Address | Dist | Beds/Ba | Sqft | Sold | Price | $/sf | Match |
|---|---|---|---|---|---|---|---|
| 5185 Appaloosa Cir | 0.11mi | 3/3.5 (-1) | 2,825 (+1%) | 10mo | $380,000 | $135 | 76 |
| 5320 Man O War Dr | 0.32mi | 4/2.5 | 2,882 (+3%) | 9mo | $380,000 | $132 | 72 |
| 5209 Man O War Dr | 0.17mi | 4/3.0 | 2,518 (-10%) | 8mo | $430,000 | $171 | 67 |
| 2727 Unbridled Way | 0.45mi | 3/3.5 (-1) | 2,769 (-1%) | 9mo | $440,000 | $159 | 61 |
| 2657 Affirmed Dr | 0.36mi | 4/2.5 | 2,559 (-8%) | 12mo | $403,000 | $157 | 60 |
| 2681 Affirmed Dr | 0.35mi | 3/2.5 (-1) | 2,559 (-8%) | 7mo | $395,000 | $154 | 59 |
| 2854 Alysheba Ct | 0.40mi | 3/3.0 (-1) | 2,560 (-8%) | 2mo | $420,000 | $164 | 59 |
| 5441 Hopewell Valley Dr | 0.70mi | 4/2.5 | 2,632 (-6%) | 1mo | $444,000 | $169 | 57 |
| 5781 Montrose Ct | 0.62mi | 5/3.5 (+1) | 2,826 (+1%) | 10mo | $395,000 | $140 | 52 |
| 5976 Outlook Ct | 0.68mi | 4/2.5 | 2,423 (-13%) | 2mo | $515,000 | $213 | 45 |
| 5783 Classicway Blvd | 0.63mi | 4/3.5 | 3,195 (+14%) | 0mo | $467,000 | $146 | 42 |
| 2843 Alysheba Ct | 0.41mi | 3/3.5 (-1) | 3,148 (+13%) | 11mo | $440,000 | $140 | 41 |
Match score weights: distance 35% · size 25% · config 20% · recency 20%. Top-matched comps best support the ARV.
Projected returns pro-forma
-3.0% appreciation · 3.0% rent growth · sell at horizon
- IRR
- 13.9%
- Equity multiple
- 1.56×
- Total profit
- $63,021
- Equity at exit
- $60,387
- IRR
- 22.7%
- Equity multiple
- 2.95×
- Total profit
- $220,643
- Equity at exit
- $35,017
Cash invested: $113,400 (down + closing). Projections, not guarantees.
Landlord ↔ Tenant lean methodology
- Overall (STATE)
- 73 Landlord-Friendly
- State Ohio
- 73 Landlord-Friendly · R+6
- County
- — inherits STATE
- City
- — inherits STATE
ZIP-level market 45152
- Home prices YoY
- -31.1%
- Active inventory
- 127
- Price-to-rent
- 5.6×
Monthly cashflow live
- Estimated rent
- $5,995 medium interval (Pro) →
- Mortgage (P&I)
- −$2,124
- Tax from tax record
- −$397 /mo · $4,766/yr
- Insurance
- −$169
- HOA
- −$27
- Vacancy / Maint / Mgmt
- −$1,259
- Net cashflow
- $2,019
Break-even live
Sensitivity live
| Price | -10% $2,249 | -5% $2,134 | +0% $2,019 | +5% $1,905 | +10% $1,790 |
|---|---|---|---|---|---|
| Rent | -10% $1,546 | -5% $1,782 | +0% $2,019 | +5% $2,256 | +10% $2,493 |
| Rate | -1.0pp $2,223 | -0.5pp $2,122 | base $2,019 | +0.5pp $1,914 | +1.0pp $1,808 |
UW: 25.0% down · 7.5% · 30yr · 1.5% tax · 5.0% vac · 8.0% maint · 8.0% mgmt
Financing live
Cash to close
- Down payment
- $101,250
- Closing costs
- $12,150
- Reserves months
- —
- Total cash needed
- —
Loan-product check · same deal, 3 products live
Conventional
25% down · 7.5% · 30yr
- Down + closing
- —
- Monthly P&I
- —
- Monthly cashflow
- —
- DSCR
- —
- Eligible?
- —
Personal DTI + credit; lowest rate.
DSCR
20% down · 8.5% · 30yr
- Down + closing
- —
- Monthly P&I
- —
- Monthly cashflow
- —
- DSCR
- —
- Eligible?
- —
No personal income docs; deal must DSCR.
Hard money
10% down · 12.0% · 12mo
- Down + closing
- —
- Monthly P&I
- —
- Monthly cashflow
- —
- DSCR
- —
- Eligible?
- —
Short-term bridge; refi at stabilization.
Rent comps 1 comps
| Address | Beds | Baths | Sqft | Rent | $/sqft | DOM | Units | Dist |
|---|---|---|---|---|---|---|---|---|
| 5738 Azra Ct Morrow, OH | 4.0 | 2.5 | 2600 | $5,995 | $2.31 | 45d | 1 | 0.61mi |
HOA detail
- Monthly dues
- $27 · $324/yr
Listing history 5 events
-
2026-06-21days on market $405,000 Active 6 DOM
-
2026-06-18days on market $405,000 Active 3 DOM
-
2026-06-17days on market $405,000 Active 2 DOM
-
2026-06-15remarks 699-char remark
-
2026-06-15$405,000 Active 1 DOM
ⓘ Source: listings_history table (triggers on properties + properties_extension) + one-shot
backfill from property_details.listing_events for pre-trigger history.
Tax reassessment forecast OH · Partial reset (capped growth)
- Current annual tax
- $4,766 · $397/mo
- Projected year-2 tax
- $5,542 · $462/mo
- Expected delta
- +$776/yr (+$65/mo · 16.3%)
ⓘ Screening estimate from a state-policy table — verify with the county assessor before closing.
Climate risk First Street
- Flood 1/10 Low FEMA zone X (unshaded) · 0% chance over 30 yrs
- Wildfire 1/10 Low
- Heat 4/10 Moderate 7 d/yr ≥101°F today · 19 d/yr by 30 yrs out
- Wind 2/10 Low 100% chance of damaging wind over 30 yrs
- Air quality 4/10 Moderate 4 unhealthy d/yr today · 6 by 30 yrs out
Nearby sold comps map
Loading sold comps map…
Walkable amenities ~0.75 mi
Loading nearby amenities…
Taxation est. · year 1
- Rental income
- $71,940
- − Mortgage interest
- −$22,686
- − Property taxes
- −$4,766
- − Insurance
- −$2,025
- − Repairs & maintenance
- −$5,755
- − Management
- −$5,755
- − HOA
- −$324
- − Depreciation
- −$11,782
- Taxable income
- $18,846
- Est. tax owed @ 24.0%
- −$4,523
- After-tax cash flow
- $19,708/yr
For passive investors: Depreciation is non-cash, so a rental often shows a tax loss while cash-flowing — sheltering income. Rental losses are passive: they offset passive income freely, and up to $25,000/yr can offset ordinary (W-2) income if you actively participate and your MAGI is under $100k (phasing out to $0 by $150k); unused losses carry forward. On sale, claimed depreciation is recaptured at up to 25%, and gains may owe capital-gains tax (a 1031 exchange can defer both). Figures are a year-1 estimate at your 24.0% rate — not tax advice; consult a CPA.
Schools (NCES district)
- District
- Little Miami Local
- NCES district ID
- 3905044
- Math proficiency
- 67% ▼ -11.00%
- Reading proficiency
- 70% ▼ -6.00%
- Median HH income
- $74,949
- Composite
- 60.5/100
- National rank
- #844
- State rank
- #140 of 656 in OH
Livability — Morrow
- Score
- 75/100
- State rank
- #266
- US rank
- #4231
Category grades
Schools grade is shown separately in the Schools card above.
Census & demographics
- County
- Warren · 227,646 people
- Metro
- Cincinnati, OH-KY-IN
- Population (ZIP)
- 13,577
- Household income
- $120,340
- Rent vs Own
- Severe rent burden
- 5.6
Population outlook (Warren County) Hauer SSP2
- Today (2025)
- 248,603 people
- By 2030
- 259,345 · +4.3%
- By 2040
- 277,666 · +11.7%
- By 2050
- 289,599 · +16.5%
- By 2075
- 311,681 · +25.4%
- By 2100
- 302,738 · +21.8%
Race, ethnicity, and origin ACS 2023
- Neighborhood character
- Predominantly White (91%)
- Race & ethnicity
- White 91% Hispanic / Latino 4% Two or more races 3% Black 2% Asian 2%
- Common ancestry
- Romanian 7% Italian 3% Lithuanian 2%
- Foreign-born
- 3% · Canada, South Korea
- Languages at home
- 96% English-only · Spanish 2% Chinese 1%
Political lean MEDSL · Warren
- 2024 margin
- Solid R (+31.5) · D 33.8% · R 65.3%
- 2008→2024 swing
- +4.5pp toward D · 2008: -36.1pp · 2024: -31.5pp
- All cycles
- 2024: R+31.5 2020: R+30.8 2016: R+37.6 2012: R+39.5 2008: R+36.1
Not yet ingested
- Civics
- —
Market trends
- HPI YoY
- ▼ -108.41%
- Current HPI
- 239.7828
- Rent YoY
- —
- Metro
- —
- State GDP YoY
- ▲ 1.98%
- F500 in state
- 48
Industry mix (Fortune 500 HQ in OH)
| Industry | F500 HQs | Revenue |
|---|---|---|
| Insurance | 3 | $145B |
|
||
| Industrial Machinery | 3 | $49B |
|
||
| Financial Services | 3 | $24B |
|
||
| Consumer Goods | 2 | $93B |
|
||
| Aerospace / Defense | 2 | $47B |
|
||
| Utilities | 2 | $33B |
|
||
Price history
+145.6% since first listed6 events — show timeline
- 2026-06-15 Listed $405,000 Cincy MLS
- 2016-06-21 Sold (Public Records) $155,000 Public Records
- 2011-10-31 Sold (MLS) $150,000 Cincy MLS
- 2011-07-07 Listing Removed — Cincy MLS
- 2011-07-07 Listed $159,000 Cincy MLS
- 2011-03-11 Listed $164,900 Cincy MLS
Property tax history
+3.0%/yrLatest (2025): $4,766 · -0.4% YoY. Source: county tax records.
Cash-flow waterfall
monthlySold comps — $/sqft
last 12 mo · ≤1 miLoading sold comps…