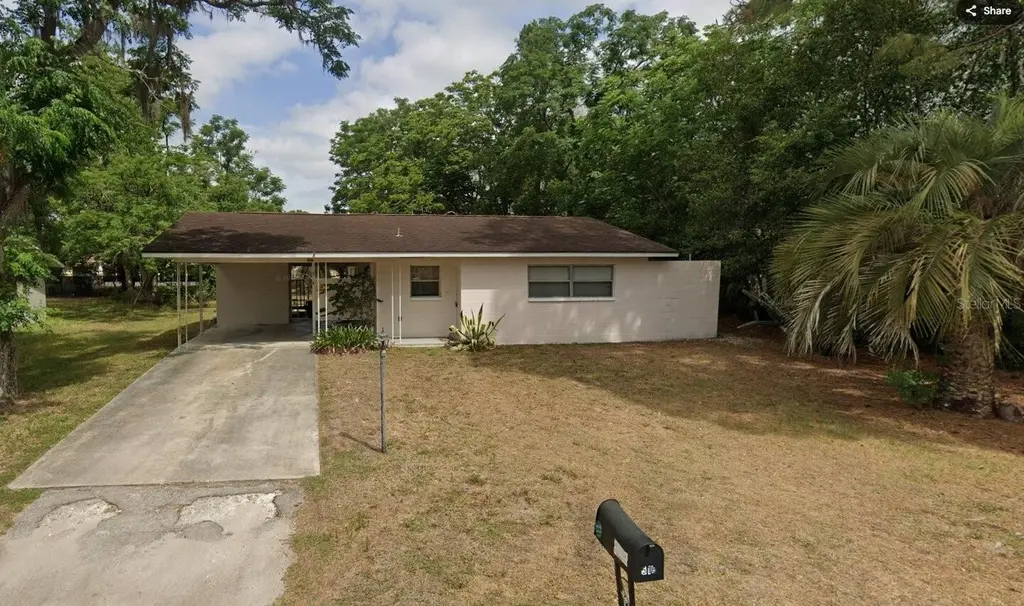
516 Bahia Track Run
Silver Springs Shores, FL 34472
$165,000C
3 bd · 2.0 ba ·
1,220 sqft ·
Built 1972
· SingleFamily
· Active
· 30 DOM
Cashflow @ list (25.0% down · 7.5%)
Estimated rent
$1,551/mo
Mortgage (P&I)
−$865
Tax + insurance
−$296
HOA
−$0
Vac / Maint / Mgmt
−$326
Net cashflow
$64/mo
Annual
$768/yr
Cap rate
6.76%
Cash-on-cash
1.66%
DSCR
1.07
1% rule
0.94%
Cash to close
$46,200
Investor read
- This is a 3-bed/2.0-bath single-family listed at $165k.
- At list price, monthly cash flow is $64 ($768/yr) — positive.
- The deal already cash-flows at list — no discount required.
- To meet the 1% rule (rent ≥ 1% of price), the offer needs to be $155k (6.0% below list).
- It's been on market 30 days — a 2% lower offer ($163k) is reasonable based on typical stale-listing flexibility.
- Recommended offer: $155k (6.0% below list) — sets the bar for 1% rule.
- In year one you build about $11k of equity ($1k loan paydown + $10k appreciation (5.9% local appreciation)).
- Location reads 68/100 on livability (#527 in FL) — a middle-class / working-renter tenant base. Strengths: cost of living A+, housing A+, health & safety A-; Watch: crime C-, employment D, schools F.
- Marion (rural): math 42% / reading 43% proficiency, ranked #61 of 73 in FL (top 84%) — families likely to look elsewhere, expect single-tenant / working-renter base with shorter leases; 61% free/reduced lunch — lower-income household profile, screen leases tightly.
- Market conditions: Rents flat; 674 active listings in the ZIP; 38 comparable units currently listed for rent nearby; rentals at typical pace (median 21d on market — plan ~3-4 weeks tenant-placement turnaround); 7,071 units permitted in Marion County in 2024 (534 in 5+ unit buildings).
- Marion County population projected at +13% by 2050 — modest demand growth; plan on rents tracking national, not racing it.
- 10 sale attempts since 9y ago; this cycle's ask has dropped $15k (8%) from the opening price — seller is motivated, your offer sets the floor, not the list.
- Current owner paid $115k; 43% above their basis — modest negotiation headroom, anchor on the comps not their cost.
- At projected returns (5.9% appreciation + 0.2% rent growth), your $46k cash investment doubles in ~4 years — after that, you're playing with house money.
- By year 4, paydown + projected appreciation supports a ~$37k cash-out refi (75% LTV) — recoverable capital for the next deal without selling this one.
- Climate carrying-cost: major flood risk; severe wind risk, 99% chance of damaging wind over 30y; extreme-heat days projected 7→23/yr by 2055 (HVAC capex compounding) — expect insurance premiums to compound above CPI over the hold.
- Cap rate 6.8% vs local median 4.7% in Silver Springs Shores — top-decile yield for the area; either an underpriced asset or a hidden risk that comps aren't pricing in. Stress-test before assuming the spread holds.
Questions for listing agent
- Built in 1972 — when were the roof, HVAC, electrical panel, plumbing, and water heater last replaced?
- Is there a deadline driving the sale (1031 exchange, divorce, estate, relocation)? That informs how much negotiation room exists.
- Schools are F-rated, which usually means shorter tenancies and higher turnover. Who's the typical renter profile here, and what's been the actual vacancy rate?
- What's the average days-on-market for RENTAL listings here right now (not sales)? A rising rental-DOM trend means longer vacancies and softer asking-rent achievability than the comps imply.
- What's the recent tenant-quality profile in this submarket — average credit score on applications, eviction rate, late-payment / NSF rate, and stable-employment percentage? A property-management company in the area should have these aggregated.
- How much new for-sale + rental construction is in the pipeline within 1–3 miles? Heavy new supply typically softens prices + rents 12–24 months out; constrained supply supports both.
CashFlowRE · CFR-PYAP4R5PDQQMX0
· Data 3 weeks ago
cashflowre.app · 2026-05-29