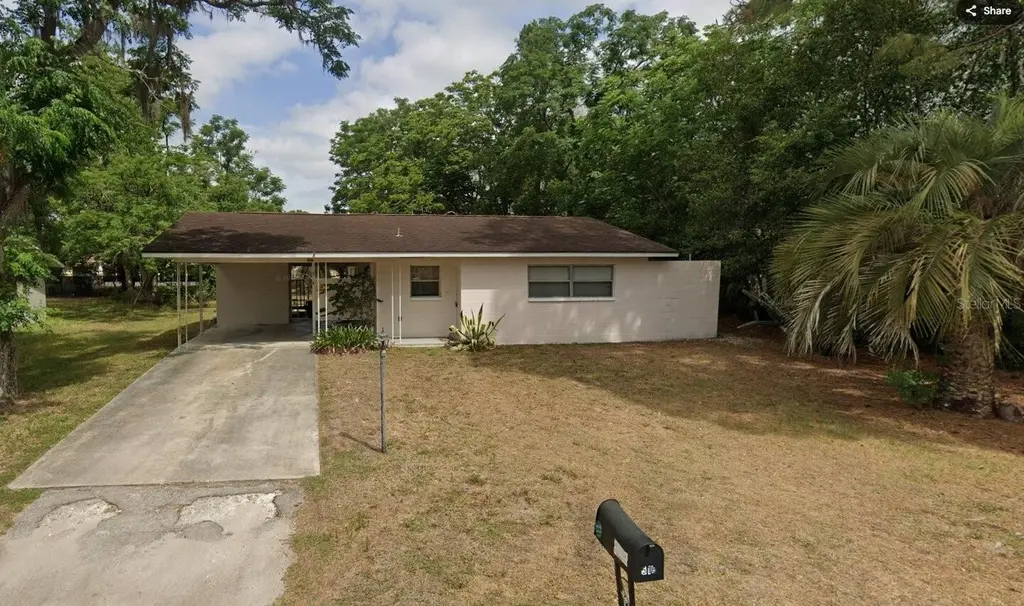
516 Bahia Track Run · Silver Springs Shores, FL
Flood risk 6/10 · Moderate
- FEMA flood zone
- X (unshaded)
- Chance of flooding over 30 yrs
- 0.7%
- Est. flood insurance / yr
- $507 – $1,088
Fire risk 4/10 · Minor
- Est. fire insurance / yr
- $947 – $1,759
Heat risk 9/10 · Severe
- Hot days now (above 108°F)
- 7 days/yr
- Hot days in 30 yrs
- 23 days/yr
Wind risk 9/10 · Severe
- Chance of severe wind over 30 yrs
- 99.0%
Air-quality risk 3/10 · Minor
- Unhealthy air days now
- 3 days/yr
- Unhealthy air days in 30 yrs
- 4 days/yr
Risk factors via First Street. Map © Google.
Why this score? — see what drove the C grade
The composite is a weighted blend of 9 inputs, each scored 0–100. Each bar is that input's sub-score; the figure is the points it added to the 100-point composite (weight × sub-score).
- Cash flow +15.4/30.0
- ARV discount +15.0/15.0
- Appreciation +8.0/10.0
- DSCR +4.7/10.0
- 1% rule +4.4/10.0
- Schools +3.6/10.0
- Livability +3.4/5.0
- Rent growth +2.5/5.0
- Condition / age +2.5/5.0
$165,000
🖨 Deal sheet 📄 Offer letter ✓ Due diligence
Listing remarks
Welcome to this charming move-in ready 3-bedroom, 2-bath home nestled on a spacious quarter-acre lot in a peaceful Ocala neighborhood. This property offers a bright, open living space with an inviting eat-in kitchen, ideal for both everyday living and entertaining. Enjoy seamless indoor-outdoor flow with multiple access points to the yard—perfect for relaxing, gardening, or hosting gatherings. Conveniently located just minutes from everyday essentials, residents enjoy easy access to nearby shopping centers, grocery stores, restaurants, and medical facilities, making daily errands simple and stress-free. Silver Springs State Park is just a short drive away, offering kayaking, hiking tr
Key facts
- Eat in kitchen
- Open living space
- 0.25 acre lot
Tags
Property features AI
Finance
- Financial info: Homestead exemption indicated; No lease restrictions noted
- HOA & community: No association (HOA) indicated; Association approval not required
Exterior
- Parking: Covered parking; Driveway; 1-car carport
- Utilities: Public water; Public sewer; Electricity connected; Water connected; Sewer connected; Cable connected; Phone available; Underground utilities
- Home design: Single family residence; One story; Entry faces southeast; Property listed as completed; Zoned R1
- Construction: Block construction; Shingle roof; Slab foundation; Built as existing (year not provided)
- Exterior features: Covered front and side porches; Porch; Private mailbox; Gazebo; Shed(s); Mature landscaping with trees; Wooded areas; Cleared and landscaped lot; Level, paved lot; 80 x 137 lot dimensions; Asphalt paved road
Interior
- Kitchen: Dishwasher; Range; Refrigerator; Electric water heater
- Bedrooms: 3 bedrooms
- Flooring: Ceramic tile; Laminate
- Bathrooms: 2 full bathrooms
- Heating & cooling: Central heating; Electric heating; Heat pump; Central air conditioning
- Interior features: Ceiling fans; Eat-in kitchen; Window treatments; Sliding doors; Storage
- Laundry & utility: Washer hookup; Dryer hookup; Dedicated laundry room
Neighborhood map
What this means for you Summary
Snapshot
- This is a 3-bed/2.0-bath single-family listed at $165k.
Deal economics
- At list price, monthly cash flow is $64 ($768/yr) — positive.
- The deal already cash-flows at list — no discount required.
- To meet the 1% rule (rent ≥ 1% of price), the offer needs to be $155k (6.0% below list).
- Recommended offer: $155k (6.0% below list) — sets the bar for 1% rule.
- Cap rate 6.8% vs local median 4.7% in Silver Springs Shores — top-decile yield for the area; either an underpriced asset or a hidden risk that comps aren't pricing in. Stress-test before assuming the spread holds.
Location & tenants
- Location reads 68/100 on livability (#527 in FL) — a middle-class / working-renter tenant base. Strengths: cost of living A+, housing A+, health & safety A-; Watch: crime C-, employment D, schools F.
- Marion (rural): math 42% / reading 43% proficiency, ranked #61 of 73 in FL (top 84%) — families likely to look elsewhere, expect single-tenant / working-renter base with shorter leases; 61% free/reduced lunch — lower-income household profile, screen leases tightly.
- Market conditions: Rents flat; 674 active listings in the ZIP; 38 comparable units currently listed for rent nearby; rentals at typical pace (median 21d on market — plan ~3-4 weeks tenant-placement turnaround); 7,071 units permitted in Marion County in 2024 (534 in 5+ unit buildings).
Forward outlook
- In year one you build about $11k of equity ($1k loan paydown + $10k appreciation (5.9% local appreciation)).
- Marion County population projected at +13% by 2050 — modest demand growth; plan on rents tracking national, not racing it.
- At projected returns (5.9% appreciation + 0.2% rent growth), your $46k cash investment doubles in ~4 years — after that, you're playing with house money.
- By year 4, paydown + projected appreciation supports a ~$37k cash-out refi (75% LTV) — recoverable capital for the next deal without selling this one.
Negotiation context
- It's been on market 30 days — a 2% lower offer ($163k) is reasonable based on typical stale-listing flexibility.
- 10 sale attempts since 9y ago; this cycle's ask has dropped $15k (8%) from the opening price — seller is motivated, your offer sets the floor, not the list.
- Current owner paid $115k; 43% above their basis — modest negotiation headroom, anchor on the comps not their cost.
Risks & watch-outs
- Climate carrying-cost: major flood risk; severe wind risk, 99% chance of damaging wind over 30y; extreme-heat days projected 7→23/yr by 2055 (HVAC capex compounding) — expect insurance premiums to compound above CPI over the hold.
Questions for the listing agent
- Built in 1972 — when were the roof, HVAC, electrical panel, plumbing, and water heater last replaced?
- Is there a deadline driving the sale (1031 exchange, divorce, estate, relocation)? That informs how much negotiation room exists.
- Schools are F-rated, which usually means shorter tenancies and higher turnover. Who's the typical renter profile here, and what's been the actual vacancy rate?
- What's the average days-on-market for RENTAL listings here right now (not sales)? A rising rental-DOM trend means longer vacancies and softer asking-rent achievability than the comps imply.
- What's the recent tenant-quality profile in this submarket — average credit score on applications, eviction rate, late-payment / NSF rate, and stable-employment percentage? A property-management company in the area should have these aggregated.
- How much new for-sale + rental construction is in the pipeline within 1–3 miles? Heavy new supply typically softens prices + rents 12–24 months out; constrained supply supports both.
Investment metrics
- 1% rule
- 0.94% ✗
- Cap rate
- 6.76%
- Cash-on-cash
- 1.66%
- DSCR
- 1.07
- GRM
- 8.9
CMA / ARV
- ARV (median comp)
- $209,802
- List price
- $165,000
- Delta
- -21.35%
- Verdict
- UNDERPRICED
- Comps
- 20 within 1.0 mi
Show comp detail 6 sales within ~0.75 mi
| Address | Dist | Beds/Ba | Sqft | Sold | Price | $/sf | Match |
|---|---|---|---|---|---|---|---|
| 806 Bahia Cir | 0.31mi | 3/2.0 | 1,270 (+4%) | 23mo | $261,000 | $206 | 60 |
| 11 Spring Lake Ln | 0.29mi | 2/2.0 (-1) | 1,180 (-3%) | 19mo | $199,900 | $169 | 60 |
| 47 Lake Court Loop | 0.68mi | 3/2.0 | 1,151 (-6%) | 4mo | $140,000 | $122 | 56 |
| 9321 Pine Ln | 0.47mi | 3/1.0 | 1,217 (-0%) | 22mo | $188,750 | $155 | 55 |
| 517 Bahia Track Ct | 0.03mi | 2/2.0 (-1) | 1,392 (+14%) | 21mo | $150,000 | $108 | 52 |
| 10 Bahia Way | 0.71mi | 3/2.0 | 1,388 (+14%) | 23mo | $220,000 | $159 | 25 |
Match score weights: distance 35% · size 25% · config 20% · recency 20%. Top-matched comps best support the ARV.
Projected returns pro-forma
5.93% appreciation · 0.17% rent growth · sell at horizon
- IRR
- 15.3%
- Equity multiple
- 2.01×
- Total profit
- $46,793
- Equity at exit
- $103,023
- IRR
- 14.5%
- Equity multiple
- 3.75×
- Total profit
- $126,934
- Equity at exit
- $186,224
Cash invested: $46,200 (down + closing). Projections, not guarantees.
Landlord ↔ Tenant lean methodology
- Overall (STATE)
- 87 Strongly Landlord-Friendly
- State Florida
- 87 Strongly Landlord-Friendly · R+3
- County
- — inherits STATE
- City
- — inherits STATE
ZIP-level market 34472
- Home prices YoY
- 2.4%
- Rents YoY
- 0.2%
- Active inventory
- 674
- Price-to-rent
- 8.9×
Monthly cashflow live
- Estimated rent
- $1,551 high interval (Pro) →
- Mortgage (P&I)
- −$865
- Tax from tax record
- −$227 /mo · $2,730/yr
- Insurance
- −$69
- HOA
- −$0
- Vacancy / Maint / Mgmt
- −$326
- Net cashflow
- $64
Break-even live
UW: 25.0% down · 7.5% · 30yr · 1.5% tax · 5.0% vac · 8.0% maint · 8.0% mgmt
Financing live
Cash to close
- Down payment
- $41,250
- Closing costs
- $4,950
- Reserves months
- —
- Total cash needed
- —
Loan-product check · same deal, 3 products live
Conventional
25% down · 7.5% · 30yr
- Down + closing
- —
- Monthly P&I
- —
- Monthly cashflow
- —
- DSCR
- —
- Eligible?
- —
Personal DTI + credit; lowest rate.
DSCR
20% down · 8.5% · 30yr
- Down + closing
- —
- Monthly P&I
- —
- Monthly cashflow
- —
- DSCR
- —
- Eligible?
- —
No personal income docs; deal must DSCR.
Hard money
10% down · 12.0% · 12mo
- Down + closing
- —
- Monthly P&I
- —
- Monthly cashflow
- —
- DSCR
- —
- Eligible?
- —
Short-term bridge; refi at stabilization.
Rent comps 38 comps
| Address | Beds | Baths | Sqft | Rent | $/sqft | DOM | Units | Dist |
|---|---|---|---|---|---|---|---|---|
| 708 Bahia Cir Ocala, FL | 3.0 | 2.0 | 1352 | $1,500 | $1.11 | 21d | 1 | 0.16mi |
| 544 Silver Crse Ocala, FL | 2.0 | 1.0 | 904 | $1,395 | $1.54 | 13d | 1 | 0.26mi |
| 633 Silver Pass Unit B Ocala, FL | 2.0 | 2.0 | 1072 | $1,500 | $1.40 | 21d | 1 | 0.32mi |
| 593 Fairways Cir Unit A Ocala, FL | 2.0 | 1.5 | 1031 | $1,200 | $1.16 | 21d | 1 | 0.32mi |
| 9337 Bahia Rd Ocala, FL | 3.0 | 2.0 | 1402 | $1,765 | $1.26 | 13d | 1 | 0.36mi |
| 549 Fairways Dr Unit A Ocala, FL | 2.0 | 2.0 | 1072 | $1,200 | $1.12 | 21d | 1 | 0.37mi |
| 54 Pine Trak Unit 104F Ocala, FL | 2.0 | 2.0 | 832 | $1,300 | $1.56 | 21d | 1 | 0.38mi |
| 561 Fairways Cir Unit A Ocala, FL | 2.0 | 1.5 | 1031 | $1,250 | $1.21 | 21d | 1 | 0.38mi |
| 553 Fairways Cir Unit B Ocala, FL | 2.0 | 2.0 | 1304 | $1,700 | $1.30 | 13d | 1 | 0.41mi |
| 532 Bahia Cir Unit A Ocala, FL | 2.0 | 1.5 | 1027 | $1,300 | $1.27 | 21d | 1 | 0.41mi |
| 478 Water Pl Ocala, FL | 3.0 | 2.0 | 1228 | $1,650 | $1.34 | 21d | 1 | 0.42mi |
| 58 Pine Trak Unit 104D Ocala, FL | 2.0 | 2.0 | 832 | $1,050 | $1.26 | 21d | 1 | 0.42mi |
| 62 Pine Trak Ocala, FL | 2.0 | 2.0 | 832 | $1,250 | $1.50 | 21d | 1 | 0.47mi |
| 582 Fairways Cir Unit A Ocala, FL | 2.0 | 2.0 | 1304 | $1,500 | $1.15 | 21d | 1 | 0.47mi |
| 520 Fairways Cir Unit A Ocala, FL | 2.0 | 1.5 | 1027 | $1,100 | $1.07 | 21d | 1 | 0.47mi |
| 548 Fairways Cir Unit C102 Ocala, FL | 2.0 | 2.0 | 850 | $1,400 | $1.65 | 21d | 1 | 0.49mi |
| 510 Fairways Cir Unit A Ocala, FL | 2.0 | 2.0 | 1000 | $1,299 | $1.30 | 21d | 1 | 0.49mi |
| 455 Water Rd Ocala, FL | 3.0 | 2.0 | 1275 | $1,450 | $1.14 | 13d | 1 | 0.53mi |
| 576 Fairways Ln Unit M104 Ocala, FL | 2.0 | 2.0 | 837 | $1,250 | $1.49 | 21d | 1 | 0.54mi |
| 446 Water Rd Ocala, FL | 3.0 | 2.0 | 1248 | $1,425 | $1.14 | 21d | 1 | 0.55mi |
| 454 Fairways Cir Ocala, FL | 2.0 | 2.0 | 837 | $1,200 | $1.43 | 21d | 1 | 0.57mi |
| 454 Fairways Cir Unit B203 Ocala, FL | 2.0 | 2.0 | 850 | $1,375 | $1.62 | 21d | 1 | 0.57mi |
| 454 Fairways Cir Unit B204 Ocala, FL | 2.0 | 2.0 | 837 | $1,289 | $1.54 | 21d | 1 | 0.57mi |
| 567 Midway Trak Unit H201 Ocala, FL | 3.0 | 2.0 | 1029 | $1,350 | $1.31 | 13d | 1 | 0.59mi |
| 681 Midway Dr Unit A Ocala, FL | 2.0 | 2.0 | 1000 | $1,250 | $1.25 | 21d | 1 | 0.61mi |
| 681 Midway Dr Unit A Ocala, FL | 2.0 | 2.0 | 1000 | $1,250 | $1.25 | 13d | 1 | 0.61mi |
| 608 Midway Dr Unit A Ocala, FL | 2.0 | 1.5 | 1054 | $1,500 | $1.42 | 13d | 1 | 0.71mi |
| 12 Spring Loop Ocala, FL | 2.0 | 1.0 | 900 | $1,350 | $1.50 | 13d | 1 | 0.76mi |
| 13 Pine Radial Dr Ocala, FL | 3.0 | 2.0 | 1453 | $1,795 | $1.24 | 21d | 1 | 0.92mi |
| 60 Bahia Court Trak Ocala, FL | 3.0 | 2.0 | 1413 | $1,695 | $1.20 | 21d | 1 | 0.93mi |
| 162 Bahia Terrace Dr Ocala, FL | 2.0 | 2.0 | 984 | $1,375 | $1.40 | 21d | 1 | 0.98mi |
| 5 Cedar Ln Ocala, FL | 3.0 | 2.0 | 1064 | $1,750 | $1.64 | 21d | 1 | 1.00mi |
| 43 Bahia Pass Ocala, FL | 3.0 | 2.0 | 1188 | $1,475 | $1.24 | 21d | 1 | 1.09mi |
| 9649 Bahia Rd Ocala, FL | 3.0 | 2.0 | 1282 | $1,595 | $1.24 | 21d | 1 | 1.20mi |
| 7184 Hemlock Loop Ocala, FL | 3.0 | 2.0 | 1392 | $1,675 | $1.20 | 21d | 1 | 1.23mi |
| 7455 Midway Ter Unit K Ocala, FL | 2.0 | 1.0 | 904 | $1,249 | $1.38 | 21d | 1 | 1.30mi |
| 27 Sapphire Run Ocala, FL | 3.0 | 2.0 | 1255 | $1,500 | $1.20 | 21d | 1 | 1.41mi |
| 7 Pine Run Ter Ocala, FL | 3.0 | 2.0 | 1432 | $1,500 | $1.05 | 13d | 1 | 1.42mi |
Listing history 29 events
-
2026-05-01price $165,000 1300-char remark
-
2026-04-27$179,900 Active 1300-char remark
-
2026-04-24historical
-
2026-04-19status Active
-
2026-04-10status Pending
-
2026-02-06price $180,000
-
2026-01-21$185,000 Active
-
2025-12-16historical
-
2025-12-10historical $1,500
-
2025-10-30price $190,000
-
2025-10-14price $195,000
-
2025-09-26$200,000 Active
-
2025-09-20$1,500
-
2025-09-12historical
-
2025-08-11price $200,000
-
2025-07-25$239,900 Active
-
2019-10-23soldstatus $115,000
-
2019-10-18soldstatus $115,000
-
2019-07-30$115,000
-
2018-03-23soldstatus $84,500
-
2018-03-19soldstatus $84,500
-
2018-03-19soldstatus $84,500
-
2018-01-05$84,500
-
2018-01-05$84,500
-
2017-12-11historical
-
2017-12-05$84,500
-
2002-08-01soldstatus $42,000
-
1997-04-10soldstatus $44,000
-
1985-11-01soldstatus $50,000
ⓘ Source: listings_history table (triggers on properties + properties_extension) + one-shot
backfill from property_details.listing_events for pre-trigger history.
Tax reassessment forecast FL · Resets to sale price
- Current annual tax
- $2,730 · $227/mo
- Projected year-2 tax
- $2,730 · $227/mo
- Expected delta
- $0/yr ($0/mo · 0.0%)
ⓘ Screening estimate from a state-policy table — verify with the county assessor before closing.
Climate risk First Street
- Flood 6/10 Major FEMA zone X (unshaded) · 70% chance over 30 yrs
- Wildfire 4/10 Moderate
- Heat 9/10 Extreme 7 d/yr ≥108°F today · 23 d/yr by 30 yrs out
- Wind 9/10 Extreme 99% chance of damaging wind over 30 yrs
- Air quality 3/10 Moderate 3 unhealthy d/yr today · 4 by 30 yrs out
Nearby sold comps map
Loading sold comps map…
Walkable amenities ~0.75 mi
Loading nearby amenities…
Taxation est. · year 1
- Rental income
- $18,615
- − Mortgage interest
- −$9,243
- − Property taxes
- −$2,730
- − Insurance
- −$825
- − Repairs & maintenance
- −$1,489
- − Management
- −$1,489
- − Depreciation
- −$4,800
- Taxable loss
- −$1,961
- Est. tax savings @ 24.0%
- +$471
- After-tax cash flow
- $1,238/yr
For passive investors: Depreciation is non-cash, so a rental often shows a tax loss while cash-flowing — sheltering income. Rental losses are passive: they offset passive income freely, and up to $25,000/yr can offset ordinary (W-2) income if you actively participate and your MAGI is under $100k (phasing out to $0 by $150k); unused losses carry forward. On sale, claimed depreciation is recaptured at up to 25%, and gains may owe capital-gains tax (a 1031 exchange can defer both). Figures are a year-1 estimate at your 24.0% rate — not tax advice; consult a CPA.
Schools (NCES district)
- District
- Marion
- NCES district ID
- 1201260
- Math proficiency
- 42% ▼ -7.00%
- Reading proficiency
- 43% ▼ -4.00%
- Median HH income
- $40,015
- Composite
- 35.61/100
- National rank
- #4890
- State rank
- #61 of 73 in FL
Livability — Silver Springs Shores
- Score
- 68/100
- State rank
- #527
- US rank
- #9854
Category grades
Schools grade is shown separately in the Schools card above.
Census & demographics
- Census place
- Silver Springs Shores, FL
- County
- Marion County · 315,796 people
- City population
- 34,665
- Metro
- Ocala, FL
- Population (ZIP)
- 35,851
- Household income
- $64,208
- Rent vs Own
- Severe rent burden
- 655.0
Population outlook (Marion County) Hauer SSP2
- Today (2025)
- 365,905 people
- By 2030
- 376,768 · +3.0%
- By 2040
- 396,555 · +8.4%
- By 2050
- 412,723 · +12.8%
- By 2075
- 446,090 · +21.9%
- By 2100
- 436,193 · +19.2%
Race, ethnicity, and origin ACS 2023
- Neighborhood character
- Diverse neighborhood (Simpson 0.65)
- Race & ethnicity
- White 50% Hispanic / Latino 25% Black 21% Two or more races 18% Asian 2%
- Hispanic origin (detail)
- Mexican 2% Puerto Rican 14% Cuban 3%
- Common ancestry
- Romanian 2% Iranian 1% Lithuanian 1%
- Foreign-born
- 11% · Canada, Jamaica, China
- Languages at home
- 78% English-only · Spanish 19% Other Indo-European 1%
Political lean MEDSL · Marion
- 2024 margin
- Solid R (+31.6) · D 33.8% · R 65.5%
- 2008→2024 swing
- -20.0pp toward R · 2008: -11.6pp · 2024: -31.6pp
- All cycles
- 2024: R+31.6 2020: R+25.9 2016: R+26.2 2012: R+16.2 2008: R+11.6
Not yet ingested
- Civics
- —
Market trends
- HPI YoY
- ▲ 5.93%
- Current HPI
- 255.0714
- Rent YoY
- ▲ 0.17%
- Metro
- Ocala, FL
- State GDP YoY
- ▲ 3.28%
- F500 in state
- 36
Industry mix (Fortune 500 HQ in FL)
| Industry | F500 HQs | Revenue |
|---|---|---|
| Industrial Technology | 2 | $29B |
|
||
| Insurance | 2 | $17B |
|
||
| Retail | 1 | $60B |
|
||
| Technology Distribution | 1 | $58B |
|
||
| Homebuilding | 1 | $35B |
|
||
| Technology Manufacturing | 1 | $35B |
|
||
Price history
+230.0% since first listed30 events — show timeline
- 2026-05-27 Listing Removed — Stellar MLS as Distributed by MLS Grid
- 2026-05-01 Price Changed $165,000 Stellar MLS as Distributed by MLS Grid
- 2026-04-27 Listed $179,900 Stellar MLS as Distributed by MLS Grid
- 2026-04-24 Listing Removed — Stellar MLS as Distributed by MLS Grid
- 2026-04-19 Relisted — Stellar MLS as Distributed by MLS Grid
- 2026-04-10 Pending — Stellar MLS as Distributed by MLS Grid
- 2026-02-06 Price Changed $180,000 Stellar MLS as Distributed by MLS Grid
- 2026-01-21 Listed $185,000 Stellar MLS as Distributed by MLS Grid
- 2025-12-16 Listing Removed — Stellar MLS as Distributed by MLS Grid
- 2025-12-10 Rental Removed $1,500 STELLARMLS
- 2025-10-30 Price Changed $190,000 Stellar MLS as Distributed by MLS Grid
- 2025-10-14 Price Changed $195,000 Stellar MLS as Distributed by MLS Grid
- 2025-09-26 Listed $200,000 Stellar MLS as Distributed by MLS Grid
- 2025-09-20 Listed for Rent $1,500 STELLARMLS
- 2025-09-12 Listing Removed — Stellar MLS as Distributed by MLS Grid
- 2025-08-11 Price Changed $200,000 Stellar MLS as Distributed by MLS Grid
- 2025-07-25 Listed $239,900 Stellar MLS as Distributed by MLS Grid
- 2019-10-23 Sold (Public Records) $115,000 Public Records
- 2019-10-18 Sold (MLS) $115,000 Stellar MLS as Distributed by MLS Grid
- 2019-07-30 Listed $115,000 Stellar MLS as Distributed by MLS Grid
- 2018-03-23 Sold (Public Records) $84,500 Public Records
- 2018-03-19 Sold (MLS) $84,500 Stellar MLS as Distributed by MLS Grid
- 2018-03-19 Sold (MLS) $84,500 Stellar MLS as Distributed by MLS Grid
- 2018-01-05 Listed $84,500 Stellar MLS as Distributed by MLS Grid
- 2018-01-05 Listed $84,500 Stellar MLS as Distributed by MLS Grid
- 2017-12-11 Listing Removed — Stellar MLS as Distributed by MLS Grid
- 2017-12-05 Listed $84,500 Stellar MLS as Distributed by MLS Grid
- 2002-08-01 Sold (Public Records) $42,000 Public Records
- 1997-04-10 Sold (Public Records) $44,000 Public Records
- 1985-11-01 Sold (Public Records) $50,000 Public Records
Property tax history
+10.3%/yrLatest (2025): $2,730 · +14.3% YoY. Source: county tax records.
Cash-flow waterfall
monthlySold comps — $/sqft
last 12 mo · ≤1 miLoading sold comps…