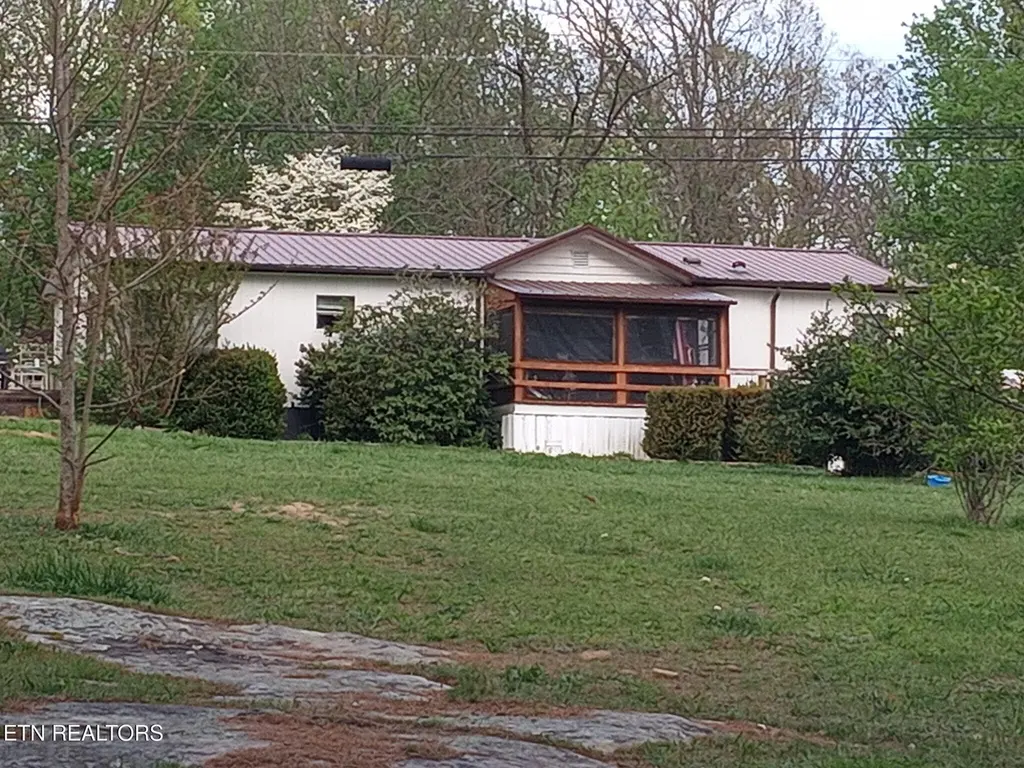
145 Florida Ave
Lake Tansi, TN 38572
$220,000D
3 bd · 2.0 ba ·
1,352 sqft ·
Built 1990
· SingleFamily
· Active
· 52 DOM
Cashflow @ list (25.0% down · 7.5%)
Estimated rent
$1,635/mo
Mortgage (P&I)
−$1,154
Tax + insurance
−$367
HOA
−$0
Vac / Maint / Mgmt
−$343
Net cashflow
$-229/mo
Annual
$-2,748/yr
Cap rate
5.04%
Cash-on-cash
-4.46%
DSCR
0.80
1% rule
0.74%
Cash to close
$61,600
Investor read
- This is a 3-bed/2.0-bath single-family listed at $220k.
- At list price, monthly cash flow is $-229 ($-3k/yr) — negative.
- To cash-flow at today's rent, offer at most $187k (15.1% below list).
- To meet the 1% rule (rent ≥ 1% of price), the offer needs to be $163k (25.7% below list).
- It's been on market 52 days — a 3% lower offer ($213k) is reasonable based on typical stale-listing flexibility.
- Recommended offer: $163k (25.7% below list) — sets the bar for 1% rule.
- In year one you build about $24k of equity ($2k loan paydown + $22k appreciation (10.0% local appreciation)).
- Location reads 61/100 on livability (#245 in TN) — a middle-class / working-renter tenant base. Strengths: cost of living A+, housing A+; Watch: employment C-, amenities F, commute F.
- Cumberland County (rural): math 30% / reading 31% proficiency, ranked #59 of 139 in TN (top 42%) — families likely to look elsewhere, expect single-tenant / working-renter base with shorter leases.
- Zoned schools: South Cumberland Elementary (math 47% / reading 39%, grade F, #187 of 952 statewide, top 20%, 587 students, 0% FRL); Cumberland County High School (math 28% / reading 41%, grade F, #41 of 332 statewide, top 15%, 985 students, 0% FRL) — zoned schools average 0% FRL vs 56% district-wide (56 pts lower); this property's tenant base skews higher-income than the district average.
- Market conditions: 447 active listings in the ZIP; 114 units permitted in Cumberland County in 2024 (0 in 5+ unit buildings).
- Cumberland County population projected at +7% by 2050 — modest demand growth; plan on rents tracking national, not racing it.
- 2 sale attempts with the ask held roughly flat each time — persistent listings suggest the price (not the market) is what's stuck; bring a comps-based counter.
- Current owner paid $58k; list at $220k implies a 279% gain — meaningful room to come down on a strong offer.
- By year 2, paydown + projected appreciation supports a ~$38k cash-out refi (75% LTV) — recoverable capital for the next deal without selling this one.
- Climate carrying-cost: moderate wildfire risk — expect insurance premiums to compound above CPI over the hold.
Questions for listing agent
- What do current leases actually rent for vs. the listed asking? Can we see a recent rent roll and the last 12 months of T-12 income?
- It's been on market 52 days. Have you received any prior offers? Is the seller open to a 26% concession, seller financing, or rate buy-down credit?
- Is there a deadline driving the sale (1031 exchange, divorce, estate, relocation)? That informs how much negotiation room exists.
- Schools are F-rated, which usually means shorter tenancies and higher turnover. Who's the typical renter profile here, and what's been the actual vacancy rate?
- The area grade is low — what's the realistic commute time and amenity access for the typical tenant pool here? Any planned neighborhood developments (good or bad) we should know about?
- What's the average days-on-market for RENTAL listings here right now (not sales)? A rising rental-DOM trend means longer vacancies and softer asking-rent achievability than the comps imply.
- What's the recent tenant-quality profile in this submarket — average credit score on applications, eviction rate, late-payment / NSF rate, and stable-employment percentage? A property-management company in the area should have these aggregated.
- How much new for-sale + rental construction is in the pipeline within 1–3 miles? Heavy new supply typically softens prices + rents 12–24 months out; constrained supply supports both.
CashFlowRE · CFR-Q02A6Q86BYQRHG
· Data 2 days ago
cashflowre.app · 2026-05-29