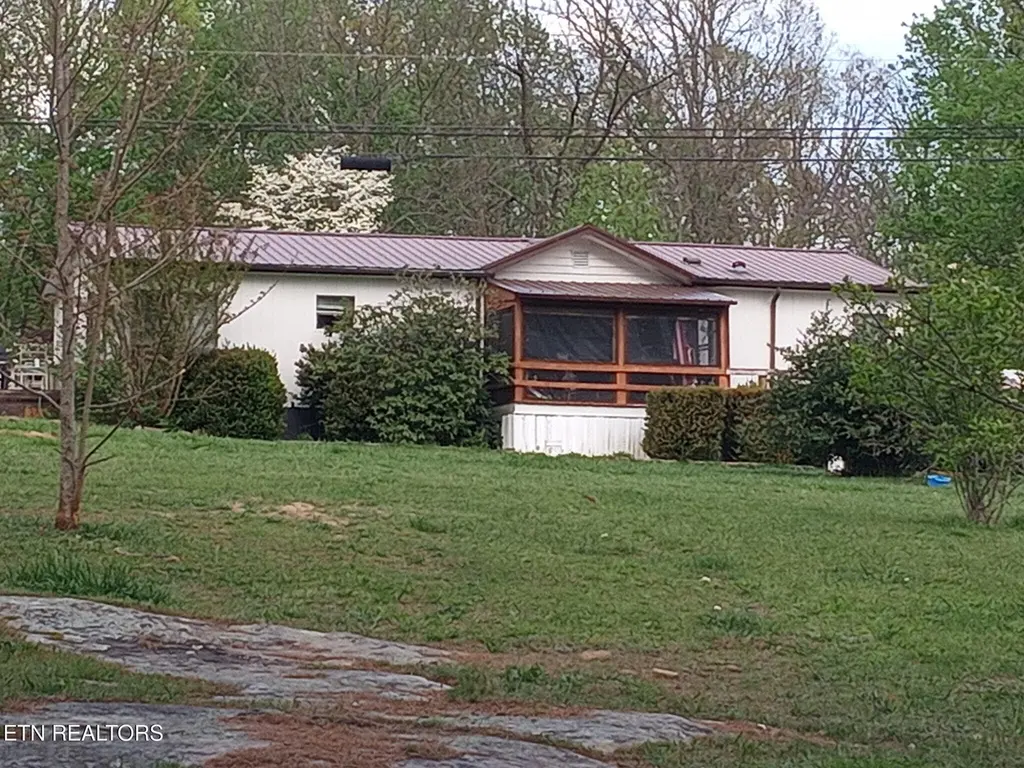
145 Florida Ave · Lake Tansi, TN
Flood risk 1/10 · Minimal
- FEMA flood zone
- X (unshaded)
- Chance of flooding over 30 yrs
- 0.0%
- Est. flood insurance / yr
- $507 – $1,088
Fire risk 5/10 · Moderate
- Est. fire insurance / yr
- $949 – $1,763
Heat risk 3/10 · Minor
- Hot days now (above 97°F)
- 7 days/yr
- Hot days in 30 yrs
- 20 days/yr
Wind risk 3/10 · Minor
- Chance of severe wind over 30 yrs
- 7.0%
Air-quality risk 3/10 · Minor
- Unhealthy air days now
- 2 days/yr
- Unhealthy air days in 30 yrs
- 3 days/yr
Risk factors via First Street. Map © Google.
Why this score? — see what drove the D grade
The composite is a weighted blend of 9 inputs, each scored 0–100. Each bar is that input's sub-score; the figure is the points it added to the 100-point composite (weight × sub-score).
- Appreciation +10.0/10.0
- Cash flow +8.0/30.0
- ARV discount +7.5/15.0
- Livability +3.1/5.0
- Schools +2.6/10.0
- Rent growth +2.5/5.0
- Condition / age +2.5/5.0
- 1% rule +2.4/10.0
- DSCR +2.0/10.0
$220,000
🖨 Deal sheet 📄 Offer letter ✓ Due diligence
Listing remarks
Welcome to the beautifully updated home located at 145 Florida Ave located in the heart of Crossville, Tennessee! This charming property offers the perfect blend of modern upgrades and comfortable living, making it move-in ready for its next owner or an investment property. Step inside to discover a thoughtfully refreshed interior featuring updated flooring and fresh paint throughout with handicap accessible ramps on both ends of the home. The spacious living area provides a warm and inviting atmosphere with an open concept, perfect for relaxing or entertaining guests. The kitchen has been tastefully updated with modern touches, offering plenty of cabinet space and functionality for everyda
Key facts
- 1 acre lot
- Parking
- Built 1990
Property features AI
Exterior
- Parking: Carport (1 space)
- Utilities: Septic tank
- Home design: Detached property; Single-story (entry level not specified)
- Construction: Vinyl siding on frame construction
- Exterior features: Storage structure; Level lot; Country setting with wooded view; Lot dimensions approximately 112 x 278 (irregular)
Interior
- Kitchen: Dishwasher; Microwave; Self-cleaning oven; Refrigerator; Eat-in kitchen
- Bedrooms: Master bedroom; Bedroom 2; Bedroom 3
- Flooring: Laminate; Carpet
- Bathrooms: 2 full bathrooms
- Heating & cooling: Central heating (natural gas); Central cooling
- Interior features: Walk-in closet(s); Cathedral ceilings; Pantry; Eat-in kitchen; 7 total rooms; Gas log fireplace
- Laundry & utility: Washer; Dryer; Handicapped equipped
Neighborhood map
What this means for you Summary
Snapshot
- This is a 3-bed/2.0-bath single-family listed at $220k.
Deal economics
- At list price, monthly cash flow is $-229 ($-3k/yr) — negative.
- To cash-flow at today's rent, offer at most $187k (15.1% below list).
- To meet the 1% rule (rent ≥ 1% of price), the offer needs to be $163k (25.7% below list).
- Recommended offer: $163k (25.7% below list) — sets the bar for 1% rule.
Location & tenants
- Location reads 61/100 on livability (#245 in TN) — a middle-class / working-renter tenant base. Strengths: cost of living A+, housing A+; Watch: employment C-, amenities F, commute F.
- Cumberland County (rural): math 30% / reading 31% proficiency, ranked #59 of 139 in TN (top 42%) — families likely to look elsewhere, expect single-tenant / working-renter base with shorter leases.
- Zoned schools: South Cumberland Elementary (math 47% / reading 39%, grade F, #187 of 952 statewide, top 20%, 587 students, 0% FRL); Cumberland County High School (math 28% / reading 41%, grade F, #41 of 332 statewide, top 15%, 985 students, 0% FRL) — zoned schools average 0% FRL vs 56% district-wide (56 pts lower); this property's tenant base skews higher-income than the district average.
- Market conditions: 447 active listings in the ZIP; 114 units permitted in Cumberland County in 2024 (0 in 5+ unit buildings).
Forward outlook
- In year one you build about $24k of equity ($2k loan paydown + $22k appreciation (10.0% local appreciation)).
- Cumberland County population projected at +7% by 2050 — modest demand growth; plan on rents tracking national, not racing it.
- By year 2, paydown + projected appreciation supports a ~$38k cash-out refi (75% LTV) — recoverable capital for the next deal without selling this one.
Negotiation context
- It's been on market 52 days — a 3% lower offer ($213k) is reasonable based on typical stale-listing flexibility.
- 2 sale attempts with the ask held roughly flat each time — persistent listings suggest the price (not the market) is what's stuck; bring a comps-based counter.
- Current owner paid $58k; list at $220k implies a 279% gain — meaningful room to come down on a strong offer.
Risks & watch-outs
- Climate carrying-cost: moderate wildfire risk — expect insurance premiums to compound above CPI over the hold.
Questions for the listing agent
- What do current leases actually rent for vs. the listed asking? Can we see a recent rent roll and the last 12 months of T-12 income?
- It's been on market 52 days. Have you received any prior offers? Is the seller open to a 26% concession, seller financing, or rate buy-down credit?
- Is there a deadline driving the sale (1031 exchange, divorce, estate, relocation)? That informs how much negotiation room exists.
- Schools are F-rated, which usually means shorter tenancies and higher turnover. Who's the typical renter profile here, and what's been the actual vacancy rate?
- The area grade is low — what's the realistic commute time and amenity access for the typical tenant pool here? Any planned neighborhood developments (good or bad) we should know about?
- What's the average days-on-market for RENTAL listings here right now (not sales)? A rising rental-DOM trend means longer vacancies and softer asking-rent achievability than the comps imply.
- What's the recent tenant-quality profile in this submarket — average credit score on applications, eviction rate, late-payment / NSF rate, and stable-employment percentage? A property-management company in the area should have these aggregated.
- How much new for-sale + rental construction is in the pipeline within 1–3 miles? Heavy new supply typically softens prices + rents 12–24 months out; constrained supply supports both.
Investment metrics
- 1% rule
- 0.74% ✗
- Cap rate
- 5.04%
- Cash-on-cash
- -4.46%
- DSCR
- 0.80
- GRM
- 11.2
CMA / ARV
No comps found within radius.
Projected returns pro-forma
10.0% appreciation · 3.0% rent growth · sell at horizon
- IRR
- 21.1%
- Equity multiple
- 2.71×
- Total profit
- $105,256
- Equity at exit
- $198,193
- IRR
- 19.1%
- Equity multiple
- 6.22×
- Total profit
- $321,481
- Equity at exit
- $427,412
Cash invested: $61,600 (down + closing). Projections, not guarantees.
Landlord ↔ Tenant lean methodology
- Overall (STATE)
- 87 Strongly Landlord-Friendly
- State Tennessee
- 87 Strongly Landlord-Friendly · R+13
- County
- — inherits STATE
- City
- — inherits STATE
ZIP-level market 38572
- Home prices YoY
- 10.4%
- Active inventory
- 447
- Price-to-rent
- 11.2×
Monthly cashflow live
- Estimated rent
- $1,635 medium interval (Pro) →
- Mortgage (P&I)
- −$1,154
- Tax est. 1.5%
- −$275 /mo · $3,300/yr
- Insurance
- −$92
- HOA
- −$0
- Vacancy / Maint / Mgmt
- −$343
- Net cashflow
- $-229
Break-even live
UW: 25.0% down · 7.5% · 30yr · 1.5% tax · 5.0% vac · 8.0% maint · 8.0% mgmt
Financing live
Cash to close
- Down payment
- $55,000
- Closing costs
- $6,600
- Reserves months
- —
- Total cash needed
- —
Loan-product check · same deal, 3 products live
Conventional
25% down · 7.5% · 30yr
- Down + closing
- —
- Monthly P&I
- —
- Monthly cashflow
- —
- DSCR
- —
- Eligible?
- —
Personal DTI + credit; lowest rate.
DSCR
20% down · 8.5% · 30yr
- Down + closing
- —
- Monthly P&I
- —
- Monthly cashflow
- —
- DSCR
- —
- Eligible?
- —
No personal income docs; deal must DSCR.
Hard money
10% down · 12.0% · 12mo
- Down + closing
- —
- Monthly P&I
- —
- Monthly cashflow
- —
- DSCR
- —
- Eligible?
- —
Short-term bridge; refi at stabilization.
Listing history 23 events
-
2026-06-18days on market $220,000 Active 52 DOM
-
2026-06-17days on market $220,000 Active 51 DOM
-
2026-06-16days on market $220,000 Active 50 DOM
-
2026-06-15days on market $220,000 Active 49 DOM
-
2026-06-13days on market $220,000 Active 47 DOM
-
2026-06-12days on market $220,000 Active 46 DOM
-
2026-06-09days on market $220,000 Active 43 DOM
-
2026-06-08days on market $220,000 Active 42 DOM
-
2026-06-08days on market $220,000 Active 41 DOM
-
2026-06-07days on market $220,000 Active 40 DOM
-
2026-06-03days on market $220,000 Active 37 DOM
-
2026-06-02days on market $220,000 Active 36 DOM
-
2026-06-01days on market $220,000 Active 35 DOM
-
2026-05-31days on market $220,000 Active 34 DOM
-
2026-05-13$220,000 Active
-
2026-04-30soldstatus Closed
-
2026-04-15price $220,000
-
2026-04-15price $219,000
-
2026-04-15price $220,000
-
2026-04-14$219,000 Active
-
2001-02-28soldstatus $58,000
-
1992-08-13soldstatus $42,900
-
1988-09-06soldstatus $60,000
ⓘ Source: listings_history table (triggers on properties + properties_extension) + one-shot
backfill from property_details.listing_events for pre-trigger history.
Climate risk First Street
- Flood 1/10 Low FEMA zone X (unshaded) · 0% chance over 30 yrs
- Wildfire 5/10 Major
- Heat 3/10 Moderate 7 d/yr ≥97°F today · 20 d/yr by 30 yrs out
- Wind 3/10 Moderate 7% chance of damaging wind over 30 yrs
- Air quality 3/10 Moderate 2 unhealthy d/yr today · 3 by 30 yrs out
Nearby sold comps map
Loading sold comps map…
Walkable amenities ~0.75 mi
Loading nearby amenities…
Taxation est. · year 1
- Rental income
- $19,615
- − Mortgage interest
- −$12,323
- − Property taxes
- −$3,300
- − Insurance
- −$1,100
- − Repairs & maintenance
- −$1,569
- − Management
- −$1,569
- − Depreciation
- −$6,400
- Taxable loss
- −$6,646
- Est. tax savings @ 24.0%
- +$1,595
- After-tax cash flow
- $-1,153/yr
For passive investors: Depreciation is non-cash, so a rental often shows a tax loss while cash-flowing — sheltering income. Rental losses are passive: they offset passive income freely, and up to $25,000/yr can offset ordinary (W-2) income if you actively participate and your MAGI is under $100k (phasing out to $0 by $150k); unused losses carry forward. On sale, claimed depreciation is recaptured at up to 25%, and gains may owe capital-gains tax (a 1031 exchange can defer both). Figures are a year-1 estimate at your 24.0% rate — not tax advice; consult a CPA.
Schools (NCES district)
- District
- Cumberland County
- NCES district ID
- 4700900
- Math proficiency
- 30% ▼ -10.00%
- Reading proficiency
- 31% ▼ -7.00%
- Median HH income
- $38,510
- Composite
- 25.52/100
- National rank
- #7438
- State rank
- #59 of 139 in TN
Livability — Lake Tansi
- Score
- 61/100
- State rank
- #245
- US rank
- #17630
Category grades
Schools grade is shown separately in the Schools card above.
Census & demographics
- Population (ZIP)
- 12,030
Population outlook (Cumberland County) Hauer SSP2
- Today (2025)
- 61,344 people
- By 2030
- 62,611 · +2.1%
- By 2040
- 64,547 · +5.2%
- By 2050
- 65,462 · +6.7%
- By 2075
- 66,839 · +9.0%
- By 2100
- 63,855 · +4.1%
Race, ethnicity, and origin ACS 2023
- Neighborhood character
- Predominantly White (95%)
- Race & ethnicity
- White 95% Hispanic / Latino 3% Two or more races 2%
- Common ancestry
- Romanian 3% Iranian 2% Italian 2%
- Foreign-born
- 1% · Canada
Political lean MEDSL · Cumberland
- 2024 margin
- Solid R (+58.9) · D 20.2% · R 79.1%
- 2008→2024 swing
- -21.8pp toward R · 2008: -37.1pp · 2024: -58.9pp
- All cycles
- 2024: R+58.9 2020: R+57.1 2016: R+57.8 2012: R+49.1 2008: R+37.1
Not yet ingested
- Civics
- —
Market trends
- HPI YoY
- ▲ 34.68%
- Current HPI
- 367.3069
- Rent YoY
- —
- Metro
- —
- State GDP YoY
- ▲ 2.78%
- F500 in state
- 22
Industry mix (Fortune 500 HQ in TN)
| Industry | F500 HQs | Revenue |
|---|---|---|
| Healthcare | 3 | $91B |
|
||
| Retail | 3 | $72B |
|
||
| Transportation / Logistics | 1 | $88B |
|
||
| Paper / Packaging | 1 | $19B |
|
||
| Insurance | 1 | $13B |
|
||
| Energy | 1 | $12B |
|
||
Price history
+266.7% since first listed9 events — show timeline
- 2026-05-13 Listed $220,000 Knoxville MLS
- 2026-04-30 Sold (MLS) — Knoxville MLS
- 2026-04-15 Price Changed $220,000 Knoxville MLS
- 2026-04-15 Price Changed $219,000 Knoxville MLS
- 2026-04-15 Price Changed $220,000 Knoxville MLS
- 2026-04-14 Listed $219,000 Knoxville MLS
- 2001-02-28 Sold (Public Records) $58,000 Public Records
- 1992-08-13 Sold (Public Records) $42,900 Public Records
- 1988-09-06 Sold (Public Records) $60,000 Public Records
Property tax history
+2.5%/yrLatest (2025): $311 · +0.0% YoY. Source: county tax records.
Cash-flow waterfall
monthlySold comps — $/sqft
last 12 mo · ≤1 miLoading sold comps…