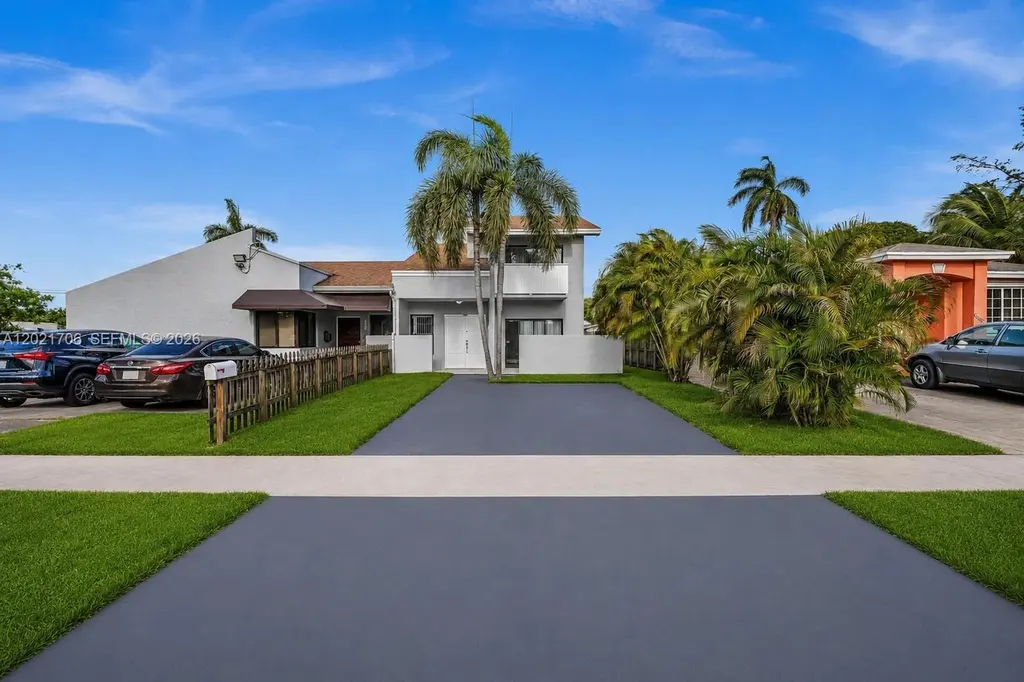
14212 NE 4th Ave
Golden Glades, FL 33161
$599,900D
2 bd · 1.0 ba ·
1,584 sqft ·
Built 1985
· SingleFamily
· Active
· 13 DOM
Cashflow @ list (25.0% down · 7.5%)
Estimated rent
$5,168/mo
Mortgage (P&I)
−$3,146
Tax + insurance
−$1,100
HOA
−$0
Vac / Maint / Mgmt
−$1,085
Net cashflow
$-164/mo
Annual
$-1,967/yr
Cap rate
6.82%
Cash-on-cash
1.88%
DSCR
1.08
1% rule
0.86%
Cash to close
$167,972
Investor read
- This is a 2-bed/1.0-bath single-family listed at $600k.
- At list price, monthly cash flow is $-164 ($-2k/yr) — negative.
- To cash-flow at today's rent, offer at most $571k (4.8% below list).
- To meet the 1% rule (rent ≥ 1% of price), the offer needs to be $517k (13.9% below list).
- Only 13 days on market — expect competitive offers; lowballing is unlikely to land.
- Recommended offer: $517k (13.9% below list) — sets the bar for 1% rule.
- Local home prices are declining (-3.0%/yr); year-one equity from $4k of loan paydown is wiped out by about $18k of value loss. Plan a longer hold.
- Location reads 74/100 on livability (#281 in FL, #4,513 nationally) — a middle-class / working-renter tenant base. Strengths: commute A+, housing B+, health & safety B+; Watch: employment D, amenities F.
- Miami-Dade (suburban): math 45% / reading 54% proficiency, ranked #40 of 73 in FL (top 55%) — families likely to look elsewhere, expect single-tenant / working-renter base with shorter leases; 64% free/reduced lunch — lower-income household profile, screen leases tightly.
- Zoned schools: Linda Lentin K-8 Center (math 27% / reading 36%, grade F, #1,841 of 2,144 statewide, top 86%, 674 students, 76% FRL); North Miami Middle School (math 25% / reading 31%, grade F, #486 of 571 statewide, top 86%, 807 students, 71% FRL); North Miami Beach Senior High (math 13% / reading 24%, grade F, #568 of 667 statewide, top 85%, 1,149 students, 66% FRL).
- Zoned-school proficiency averages 26% at this address vs 50% district-wide (-24 pts) — the specific schools serving this property underperform the Miami-Dade average; the district grade overstates school quality for this exact location.
- Watch-outs: flood insurance adds $427/mo.
- Market conditions: Rents soft (-0.7%/yr); 340 active listings in the ZIP; 10,051 units permitted in Miami-Dade County in 2024 (7,758 in 5+ unit buildings).
- Miami-Dade County population projected at +28% by 2050 — long-run rental-demand tailwind backs the buy-and-hold thesis.
- 11 sale attempts since 10y ago; this cycle's ask is 16135% above the opening price — seller raised mid-cycle; expect resistance to lowballs.
- Current owner paid $75k; list at $600k implies a 700% gain — meaningful room to come down on a strong offer.
- Climate carrying-cost: in FEMA flood zone AE (mandatory federal flood insurance); severe wind risk, 99% chance of damaging wind over 30y; extreme-heat days projected 7→29/yr by 2055 (HVAC capex compounding) — expect insurance premiums to compound above CPI over the hold.
- Cap rate 6.8% vs local median 3.6% in Golden Glades — top-decile yield for the area; either an underpriced asset or a hidden risk that comps aren't pricing in. Stress-test before assuming the spread holds.
Questions for listing agent
- What do current leases actually rent for vs. the listed asking? Can we see a recent rent roll and the last 12 months of T-12 income?
- What's the actual annual flood-insurance premium (NFIP or private), and is the property in a SFHA with mandatory coverage?
- Is there a deadline driving the sale (1031 exchange, divorce, estate, relocation)? That informs how much negotiation room exists.
- The area grade is low — what's the realistic commute time and amenity access for the typical tenant pool here? Any planned neighborhood developments (good or bad) we should know about?
- What's the average days-on-market for RENTAL listings here right now (not sales)? A rising rental-DOM trend means longer vacancies and softer asking-rent achievability than the comps imply.
- What's the recent tenant-quality profile in this submarket — average credit score on applications, eviction rate, late-payment / NSF rate, and stable-employment percentage? A property-management company in the area should have these aggregated.
- How much new for-sale + rental construction is in the pipeline within 1–3 miles? Heavy new supply typically softens prices + rents 12–24 months out; constrained supply supports both.
CashFlowRE · CFR-Q1GSC54P8CYJ88
· Data 3 weeks ago
cashflowre.app · 2026-05-29