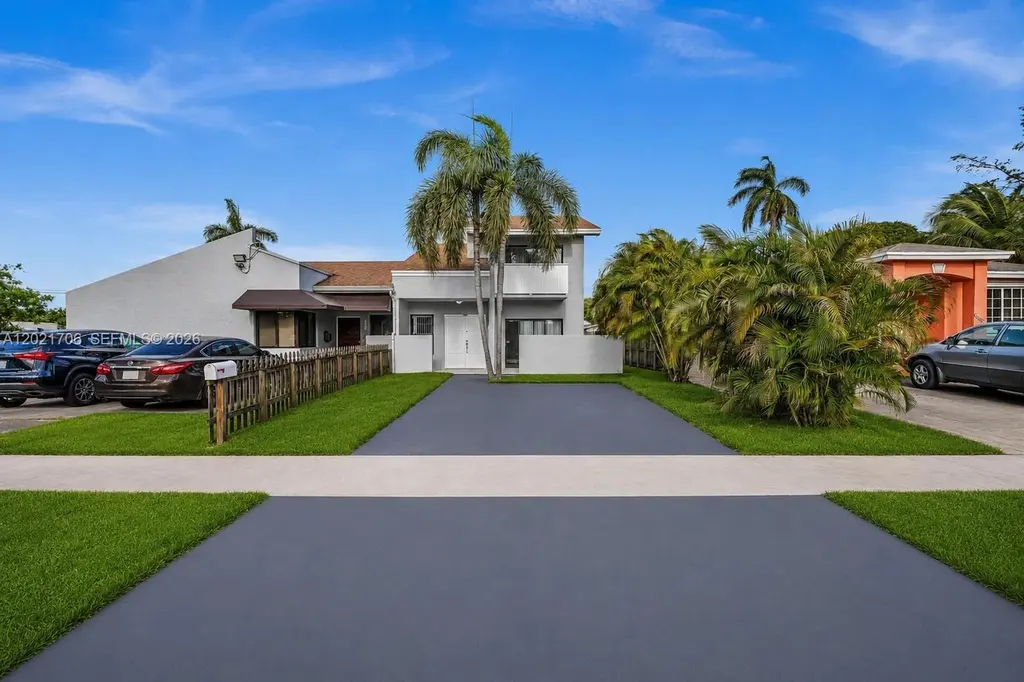
14212 NE 4th Ave · Golden Glades, FL
Flood risk 5/10 · Moderate
- FEMA flood zone
- AE
- Chance of flooding over 30 yrs
- 0.26%
- Est. flood insurance / yr
- $1,737 – $8,500
Fire risk 1/10 · Minimal
- Est. fire insurance / yr
- $947 – $1,759
Heat risk 10/10 · Severe
- Hot days now (above 104°F)
- 7 days/yr
- Hot days in 30 yrs
- 29 days/yr
Wind risk 10/10 · Severe
- Chance of severe wind over 30 yrs
- 99.0%
Air-quality risk 2/10 · Minimal
- Unhealthy air days now
- 1 days/yr
- Unhealthy air days in 30 yrs
- 2 days/yr
Risk factors via First Street. Map © Google.
Why this score? — see what drove the D grade
The composite is a weighted blend of 9 inputs, each scored 0–100. Each bar is that input's sub-score; the figure is the points it added to the 100-point composite (weight × sub-score).
- Cash flow +15.7/30.0
- DSCR +4.8/10.0
- ARV discount +4.4/15.0
- Schools +4.2/10.0
- Livability +3.7/5.0
- 1% rule +3.6/10.0
- Condition / age +2.5/5.0
- Rent growth +2.3/5.0
- Appreciation +0.0/10.0
$599,900
🖨 Deal sheet (PDF) 📄 Offer letter ✓ Due diligence
Listing remarks
Completely renovated 3 Bedroom and 2.5 Bathroom two-story single family twin-home in the heart of North Miami, featuring a large private fenced backyard. Updated with granite countertops, solid wood shaker cabinets, stainless steel appliances. Tile and new modern waterproof vinyl flooring throughout. Spacious closets, dedicated laundry room with front-load washer/dryer, and a Newer Roof (2017). Will qualify for FHA financing. Seller financing available. Move-in ready - schedule your showing today!
Key facts
- Newer roof
- Granite countertops
- 4,700 sq ft lot
Tags
Property features AI
Finance
- Financial info: Pets allowed (dogs OK)
- HOA & community: Sidewalks
Exterior
- Parking: Driveway; On-street parking
- Utilities: Public water; Public sewer
- Home design: 2-story home; Updated / remodeled; Effective year built
- Construction: Block construction; Shingle roof; Built (effective year)
- Exterior features: Fenced yard; Less than quarter-acre lot; East-facing
Interior
- Kitchen: Dishwasher; Electric range; Disposal; Microwave; Refrigerator
- Flooring: Tile flooring; Vinyl flooring
- Bathrooms: 2 full bathrooms; 1 half bathroom
- Heating & cooling: Central heating; Central air conditioning
- Interior features: First-floor entry; Upper-level primary bedroom; Walk-in closet(s)
- Laundry & utility: Laundry / utility room; Dryer
Neighborhood map
What this means for you Summary
Snapshot
- This is a 2-bed/1.0-bath single-family listed at $600k.
Deal economics
- At list price, monthly cash flow is $-164 ($-2k/yr) — negative.
- To cash-flow at today's rent, offer at most $571k (4.8% below list).
- To meet the 1% rule (rent ≥ 1% of price), the offer needs to be $517k (13.9% below list).
- Recommended offer: $517k (13.9% below list) — sets the bar for 1% rule.
- Cap rate 6.8% vs local median 3.6% in Golden Glades — top-decile yield for the area; either an underpriced asset or a hidden risk that comps aren't pricing in. Stress-test before assuming the spread holds.
Location & tenants
- Location reads 74/100 on livability (#281 in FL, #4,513 nationally) — a middle-class / working-renter tenant base. Strengths: commute A+, housing B+, health & safety B+; Watch: employment D, amenities F.
- Miami-Dade (suburban): math 45% / reading 54% proficiency, ranked #40 of 73 in FL (top 55%) — families likely to look elsewhere, expect single-tenant / working-renter base with shorter leases; 64% free/reduced lunch — lower-income household profile, screen leases tightly.
- Zoned schools: Linda Lentin K-8 Center (math 27% / reading 36%, grade F, #1,841 of 2,144 statewide, top 86%, 674 students, 76% FRL); North Miami Middle School (math 25% / reading 31%, grade F, #486 of 571 statewide, top 86%, 807 students, 71% FRL); North Miami Beach Senior High (math 13% / reading 24%, grade F, #568 of 667 statewide, top 85%, 1,149 students, 66% FRL).
- Zoned-school proficiency averages 26% at this address vs 50% district-wide (-24 pts) — the specific schools serving this property underperform the Miami-Dade average; the district grade overstates school quality for this exact location.
- Market conditions: Rents soft (-0.7%/yr); 340 active listings in the ZIP; 10,051 units permitted in Miami-Dade County in 2024 (7,758 in 5+ unit buildings).
Forward outlook
- Local home prices are declining (-3.0%/yr); year-one equity from $4k of loan paydown is wiped out by about $18k of value loss. Plan a longer hold.
- Miami-Dade County population projected at +28% by 2050 — long-run rental-demand tailwind backs the buy-and-hold thesis.
Negotiation context
- Only 13 days on market — expect competitive offers; lowballing is unlikely to land.
- 11 sale attempts since 10y ago; this cycle's ask is 16135% above the opening price — seller raised mid-cycle; expect resistance to lowballs.
- Current owner paid $75k; list at $600k implies a 700% gain — meaningful room to come down on a strong offer.
Risks & watch-outs
- Watch-outs: flood insurance adds $427/mo.
- Climate carrying-cost: in FEMA flood zone AE (mandatory federal flood insurance); severe wind risk, 99% chance of damaging wind over 30y; extreme-heat days projected 7→29/yr by 2055 (HVAC capex compounding) — expect insurance premiums to compound above CPI over the hold.
Questions for the listing agent
- What do current leases actually rent for vs. the listed asking? Can we see a recent rent roll and the last 12 months of T-12 income?
- What's the actual annual flood-insurance premium (NFIP or private), and is the property in a SFHA with mandatory coverage?
- Is there a deadline driving the sale (1031 exchange, divorce, estate, relocation)? That informs how much negotiation room exists.
- The area grade is low — what's the realistic commute time and amenity access for the typical tenant pool here? Any planned neighborhood developments (good or bad) we should know about?
- What's the average days-on-market for RENTAL listings here right now (not sales)? A rising rental-DOM trend means longer vacancies and softer asking-rent achievability than the comps imply.
- What's the recent tenant-quality profile in this submarket — average credit score on applications, eviction rate, late-payment / NSF rate, and stable-employment percentage? A property-management company in the area should have these aggregated.
- How much new for-sale + rental construction is in the pipeline within 1–3 miles? Heavy new supply typically softens prices + rents 12–24 months out; constrained supply supports both.
Investment metrics
- 1% rule
- 0.86% ✗
- Cap rate
- 6.82%
- Cash-on-cash
- 1.88%
- DSCR
- 1.08
- GRM
- 9.7
CMA / ARV
- ARV (on-the-fly)
- $560,736
- Comps found
- 5
Show comp detail 5 sales within ~0.75 mi
| Address | Dist | Beds/Ba | Sqft | Sold | Price | $/sf | Match |
|---|---|---|---|---|---|---|---|
| 13925 S Biscayne River Rd | 0.32mi | 3/2.0 (+1) | 1,520 (-4%) | 12mo | $795,000 | $523 | 59 |
| 755 NE 140th St | 0.50mi | 3/2.0 (+1) | 1,688 (+7%) | 7mo | $360,500 | $214 | 51 |
| 500 NE 132nd Ter | 0.65mi | 3/2.0 (+1) | 1,504 (-5%) | 15mo | $519,000 | $345 | 40 |
| 900 NE 147th St | 0.71mi | 3/2.0 (+1) | 1,555 (-2%) | 19mo | $550,000 | $354 | 39 |
| 10 NE 139th St | 0.52mi | 3/2.0 (+1) | 1,371 (-13%) | 16mo | $640,000 | $467 | 31 |
Match score weights: distance 35% · size 25% · config 20% · recency 20%. Top-matched comps best support the ARV.
Projected returns pro-forma
-3.0% appreciation · 0.0% rent growth · sell at horizon
- IRR
- -21.7%
- Equity multiple
- 0.27×
- Total profit
- $-122,652
- Equity at exit
- $89,447
- IRR
- -25.3%
- Equity multiple
- -0.06×
- Total profit
- $-178,203
- Equity at exit
- $51,868
Cash invested: $167,972 (down + closing). Projections, not guarantees.
Landlord ↔ Tenant lean methodology
- Overall (STATE)
- 87 Strongly Landlord-Friendly
- State Florida
- 87 Strongly Landlord-Friendly · R+3
- County
- — inherits STATE
- City
- — inherits STATE
ZIP-level market 33161
- Rents YoY
- -0.7%
- Active inventory
- 340
- Price-to-rent
- 9.7×
Monthly cashflow live
- Estimated rent
- $5,168 medium interval (Pro) →
- Mortgage (P&I)
- −$3,146
- Tax from tax record
- −$424 /mo · $5,086/yr
- Insurance
- −$250
- Flood insurance flood zone
- −$427 /mo · $5,118/yr
- HOA
- −$0
- Vacancy / Maint / Mgmt
- −$1,085
- Net cashflow
- $-164
Break-even live
Sensitivity live
| Price | -10% $176 | -5% $6 | +0% $-164 | +5% $-334 | +10% $-503 |
|---|---|---|---|---|---|
| Rent | -10% $-572 | -5% $-368 | +0% $-164 | +5% $40 | +10% $244 |
| Rate | -1.0pp $138 | -0.5pp $-11 | base $-164 | +0.5pp $-319 | +1.0pp $-477 |
UW: 25.0% down · 7.5% · 30yr · 1.5% tax · 5.0% vac · 8.0% maint · 8.0% mgmt
Financing live
Cash to close
- Down payment
- $149,975
- Closing costs
- $17,997
- Reserves months
- —
- Total cash needed
- —
Loan-product check · same deal, 3 products live
Conventional
25% down · 7.5% · 30yr
- Down + closing
- —
- Monthly P&I
- —
- Monthly cashflow
- —
- DSCR
- —
- Eligible?
- —
Personal DTI + credit; lowest rate.
DSCR
20% down · 8.5% · 30yr
- Down + closing
- —
- Monthly P&I
- —
- Monthly cashflow
- —
- DSCR
- —
- Eligible?
- —
No personal income docs; deal must DSCR.
Hard money
10% down · 12.0% · 12mo
- Down + closing
- —
- Monthly P&I
- —
- Monthly cashflow
- —
- DSCR
- —
- Eligible?
- —
Short-term bridge; refi at stabilization.
Listing history 31 events
-
2026-06-01days on market $599,900 Active 13 DOM
-
2026-05-31days on market $599,900 Active 12 DOM
-
2026-05-20$3,695
-
2026-05-20historical $3,695
-
2026-05-19$599,900 Active
-
2026-05-19historical
-
2026-05-14price $609,000
-
2026-05-08price $614,000
-
2026-05-05price $3,695
-
2026-05-04$3,750
-
2026-04-29historical $3,750
-
2026-04-29price $617,500
-
2026-04-29$3,750
-
2026-04-28historical $3,895
-
2026-04-25$3,895
-
2026-04-24historical $3,895
-
2026-04-22$619,900 Active
-
2026-04-16$3,895
-
2025-06-22historical $3,460
-
2025-06-21$3,460
-
2025-05-17historical $3,460
-
2025-05-16$3,460
-
2022-05-27historical
-
2022-05-17price $549,900
-
2022-05-17price $3,995
-
2022-05-09$579,900 Active
-
2019-03-18soldstatus $75,000
-
2016-07-06soldstatus $127,000 Sold
-
2016-04-04status Pending
-
2016-03-17$124,900 Active
-
1999-09-15soldstatus $108,000
ⓘ Source: listings_history table (triggers on properties + properties_extension) + one-shot
backfill from property_details.listing_events for pre-trigger history.
Tax reassessment forecast FL · Resets to sale price
- Current annual tax
- $5,086 · $424/mo
- Projected year-2 tax
- $5,086 · $424/mo
- Expected delta
- $0/yr ($0/mo · 0.0%)
ⓘ Screening estimate from a state-policy table — verify with the county assessor before closing.
Climate risk First Street
- Flood 5/10 Major FEMA zone AE · 26% chance over 30 yrs
- Wildfire 1/10 Low
- Heat 10/10 Extreme 7 d/yr ≥104°F today · 29 d/yr by 30 yrs out
- Wind 10/10 Extreme 99% chance of damaging wind over 30 yrs
- Air quality 2/10 Low 1 unhealthy d/yr today · 2 by 30 yrs out
Nearby sold comps map
Loading sold comps map…
Walkable amenities ~0.75 mi
Loading nearby amenities…
Taxation est. · year 1
- Rental income
- $62,011
- − Mortgage interest
- −$33,604
- − Property taxes
- −$5,086
- − Insurance
- −$8,118
- − Repairs & maintenance
- −$4,961
- − Management
- −$4,961
- − Depreciation
- −$17,452
- Taxable loss
- −$12,170
- Est. tax savings @ 24.0%
- +$2,921
- After-tax cash flow
- $954/yr
For passive investors: Depreciation is non-cash, so a rental often shows a tax loss while cash-flowing — sheltering income. Rental losses are passive: they offset passive income freely, and up to $25,000/yr can offset ordinary (W-2) income if you actively participate and your MAGI is under $100k (phasing out to $0 by $150k); unused losses carry forward. On sale, claimed depreciation is recaptured at up to 25%, and gains may owe capital-gains tax (a 1031 exchange can defer both). Figures are a year-1 estimate at your 24.0% rate — not tax advice; consult a CPA.
Schools (NCES district)
- District
- Miami-Dade
- NCES district ID
- 1200390
- Math proficiency
- 45% ▼ -16.00%
- Reading proficiency
- 54% ▼ -5.00%
- Median HH income
- $43,928
- Composite
- 41.76/100
- National rank
- #3397
- State rank
- #40 of 73 in FL
Livability — Golden Glades
- Score
- 74/100
- State rank
- #281
- US rank
- #4513
Category grades
Schools grade is shown separately in the Schools card above.
Census & demographics
- Census place
- Golden Glades, FL
- County
- Miami-Dade County · 2,697,751 people
- Metro
- Miami-Fort Lauderdale-Pompano Beach, FL
- Population (ZIP)
- 54,814
- Household income
- $58,325
- Rent vs Own
- Severe rent burden
- 3226.0
Population outlook (Miami-Dade County) Hauer SSP2
- Today (2025)
- 3,126,439 people
- By 2030
- 3,325,765 · +6.4%
- By 2040
- 3,697,561 · +18.3%
- By 2050
- 4,012,134 · +28.3%
- By 2075
- 4,605,612 · +47.3%
- By 2100
- 4,866,598 · +55.7%
Race, ethnicity, and origin ACS 2023
- Neighborhood character
- Diverse neighborhood (Simpson 0.58)
- Race & ethnicity
- Black 56% Hispanic / Latino 31% Two or more races 18% White 8% Asian 2%
- Hispanic origin (detail)
- Puerto Rican 4% Cuban 7% Dominican 4% Salvadoran 1%
- Common ancestry
- Hispanic 35% Estonian 1% Lithuanian 1%
- Foreign-born
- 51% · Canada, Jamaica, Dominican Republic
- Languages at home
- 25% English-only · French/Haitian/Cajun 41% Spanish 30% Other Indo-European 2%
Political lean MEDSL · Miami-Dade
- 2024 margin
- R (+11.4) · D 43.9% · R 55.4%
- 2008→2024 swing
- -27.6pp toward R · 2008: 16.1pp · 2024: -11.4pp
- All cycles
- 2024: R+11.4 2020: D+7.3 2016: D+29.6 2012: D+23.7 2008: D+16.1
Not yet ingested
- Civics
- —
Market trends
- HPI YoY
- ▼ -492.86%
- Current HPI
- 630.6932
- Rent YoY
- ▼ -0.73%
- Metro
- Miami-Fort Lauderdale-Pompano Beach, FL
- State GDP YoY
- ▲ 3.28%
- F500 in state
- 36
Industry mix (Fortune 500 HQ in FL)
| Industry | F500 HQs | Revenue |
|---|---|---|
| Industrial Technology | 2 | $29B |
|
||
| Insurance | 2 | $17B |
|
||
| Retail | 1 | $60B |
|
||
| Technology Distribution | 1 | $58B |
|
||
| Homebuilding | 1 | $35B |
|
||
| Technology Manufacturing | 1 | $35B |
|
||
Price history
-96.6% since first listed29 events — show timeline
- 2026-05-20 Listed for Rent $3,695 MARMLS
- 2026-05-20 Rental Removed $3,695 MARMLS
- 2026-05-19 Listing Removed — MARMLS
- 2026-05-19 Listed $599,900 MARMLS
- 2026-05-14 Price Changed $609,000 MARMLS
- 2026-05-08 Price Changed $614,000 MARMLS
- 2026-05-05 Price Changed $3,695 MARMLS
- 2026-05-04 Listed for Rent $3,750 MARMLS
- 2026-04-29 Rental Removed $3,750 TURBOTENANT
- 2026-04-29 Price Changed $617,500 MARMLS
- 2026-04-29 Listed for Rent $3,750 TURBOTENANT
- 2026-04-28 Rental Removed $3,895 MARMLS
- 2026-04-25 Listed for Rent $3,895 MARMLS
- 2026-04-24 Rental Removed $3,895 MARMLS
- 2026-04-22 Listed $619,900 MARMLS
- 2026-04-16 Listed for Rent $3,895 MARMLS
- 2025-06-22 Rental Removed $3,460 RENTALBEAST
- 2025-06-21 Listed for Rent $3,460 RENTALBEAST
- 2025-05-17 Rental Removed $3,460 BUILDIUM
- 2025-05-16 Listed for Rent $3,460 BUILDIUM
- 2022-05-27 Listing Removed — MARMLS
- 2022-05-17 Price Changed $549,900 MARMLS
- 2022-05-17 Price Changed $3,995 RENT.
- 2022-05-09 Listed $579,900 MARMLS
- 2019-03-18 Sold (Public Records) $75,000 Public Records
- 2016-07-06 Sold (MLS) $127,000 MARMLS
- 2016-04-04 Pending — MARMLS
- 2016-03-17 Listed $124,900 MARMLS
- 1999-09-15 Sold (Public Records) $108,000 Public Records
Property tax history
+9.6%/yrLatest (2025): $5,086 · +5.8% YoY. Source: county tax records.
Cash-flow waterfall
monthlySold comps — $/sqft
last 12 mo · ≤1 miLoading sold comps…