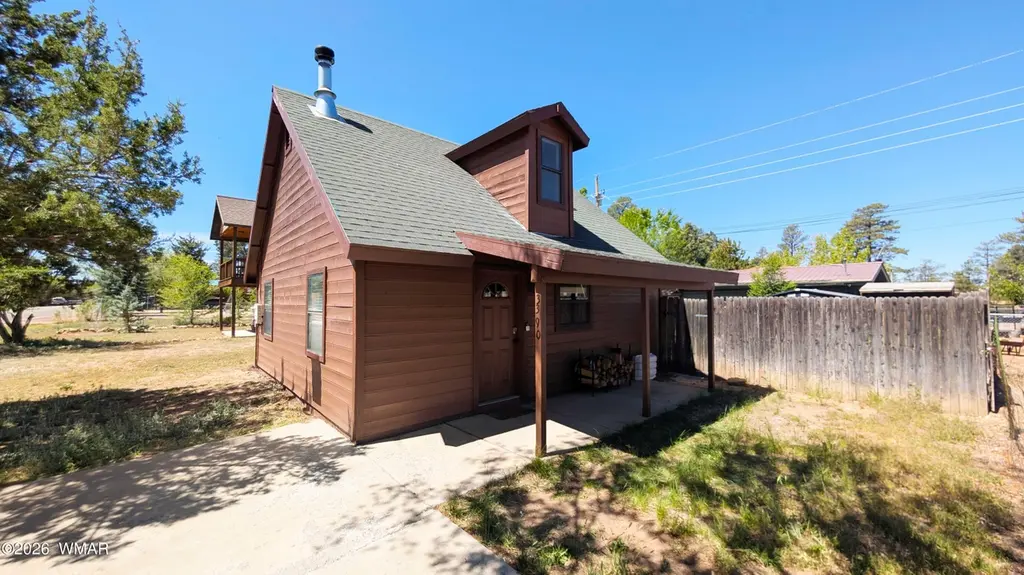
3390 Apache Dr
Heber-Overgaard, AZ 85933
$245,000D
2 bd · 1.0 ba ·
756 sqft ·
Built 2006
· SingleFamily
· Active
· 244 DOM
Cashflow @ list (25.0% down · 7.5%)
Estimated rent
$1,608/mo
Mortgage (P&I)
−$1,285
Tax + insurance
−$151
HOA
−$0
Vac / Maint / Mgmt
−$338
Net cashflow
$-165/mo
Annual
$-1,981/yr
Cap rate
5.48%
Cash-on-cash
-2.89%
DSCR
0.87
1% rule
0.66%
Cash to close
$68,600
Investor read
- This is a 2-bed/1.0-bath single-family listed at $245k.
- At list price, monthly cash flow is $-165 ($-2k/yr) — negative.
- To cash-flow at today's rent, offer at most $216k (11.9% below list).
- To meet the 1% rule (rent ≥ 1% of price), the offer needs to be $161k (34.4% below list).
- It's been on market 244 days — a 12% lower offer ($216k) is reasonable based on typical stale-listing flexibility.
- Recommended offer: $161k (34.4% below list) — sets the bar for 1% rule.
- Local home prices are declining (-3.0%/yr); year-one equity from $2k of loan paydown is wiped out by about $7k of value loss. Plan a longer hold.
- Location reads: area grade D — affects rentability + tenant quality, not the cash-flow math above.
- Heber-Overgaard Unified District (4392) (rural): math 52% / reading 45% proficiency, ranked #51 of 249 in AZ (top 20%) — families likely to look elsewhere, expect single-tenant / working-renter base with shorter leases.
- Market conditions: 254 active listings in the ZIP; 485 units permitted in Navajo County in 2024 (11 in 5+ unit buildings).
- Navajo County population projected at -16% by 2050 — secular population decline; favor cash flow + early exit over multi-decade hold.
- 3 sale attempts since 5y ago with the ask held roughly flat each time — persistent listings suggest the price (not the market) is what's stuck; bring a comps-based counter.
- Climate carrying-cost: major wildfire risk — expect insurance premiums to compound above CPI over the hold.
- Cap rate 5.5% vs local median 3.2% in Heber-Overgaard — top-decile yield for the area; either an underpriced asset or a hidden risk that comps aren't pricing in. Stress-test before assuming the spread holds.
Questions for listing agent
- What do current leases actually rent for vs. the listed asking? Can we see a recent rent roll and the last 12 months of T-12 income?
- It's been on market 244 days. Have you received any prior offers? Is the seller open to a 34% concession, seller financing, or rate buy-down credit?
- Why hasn't it sold? Are there any deal-killer items the seller is aware of (foundation, flood, title, zoning, code violations)?
- Is there a deadline driving the sale (1031 exchange, divorce, estate, relocation)? That informs how much negotiation room exists.
- The area grade is low — what's the realistic commute time and amenity access for the typical tenant pool here? Any planned neighborhood developments (good or bad) we should know about?
- What's the average days-on-market for RENTAL listings here right now (not sales)? A rising rental-DOM trend means longer vacancies and softer asking-rent achievability than the comps imply.
- What's the recent tenant-quality profile in this submarket — average credit score on applications, eviction rate, late-payment / NSF rate, and stable-employment percentage? A property-management company in the area should have these aggregated.
- How much new for-sale + rental construction is in the pipeline within 1–3 miles? Heavy new supply typically softens prices + rents 12–24 months out; constrained supply supports both.
CashFlowRE · CFR-Q2KXAE61FW08SB
· Data 1 day ago
cashflowre.app · 2026-05-29