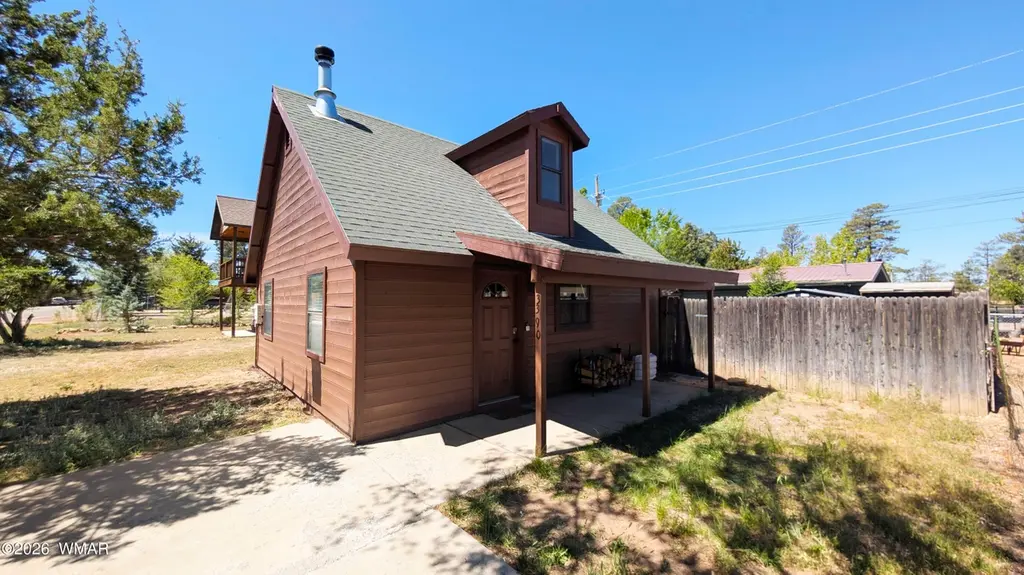
3390 Apache Dr · Heber-Overgaard, AZ
Flood risk 1/10 · Minimal
- FEMA flood zone
- X (unshaded)
- Chance of flooding over 30 yrs
- 0.0%
- Est. flood insurance / yr
- $507 – $1,088
Fire risk 7/10 · Major
- Est. fire insurance / yr
- $610 – $1,132
Heat risk 2/10 · Minimal
- Hot days now (above 88°F)
- 7 days/yr
- Hot days in 30 yrs
- 18 days/yr
Wind risk 1/10 · Minimal
- Chance of severe wind over 30 yrs
- —
Air-quality risk 1/10 · Minimal
- Unhealthy air days now
- 0 days/yr
- Unhealthy air days in 30 yrs
- 0 days/yr
Risk factors via First Street. Map © Google.
Why this score? — see what drove the D grade
The composite is a weighted blend of 9 inputs, each scored 0–100. Each bar is that input's sub-score; the figure is the points it added to the 100-point composite (weight × sub-score).
- ARV discount +15.0/15.0
- Cash flow +9.6/30.0
- Schools +4.0/10.0
- DSCR +2.7/10.0
- Rent growth +2.5/5.0
- Livability +2.5/5.0
- Condition / age +2.5/5.0
- 1% rule +1.6/10.0
- Appreciation +0.0/10.0
$245,000
🖨 Deal sheet 📄 Offer letter ✓ Due diligence
Listing remarks MLS
Cozy cabin in the COOL PINES! This little gem won't last long and has everything you need to move right in and start enjoying your cool summer days in HEBER/OVERGAARD! Equipped with Solar you can rest assured that your electric bill will be super low! 2 bed 1 bath with a real wood burning stove in living room! Its close to everything you would ever need! Large spacious lot!
Key facts
- Solar panels
- Wood burning stove
- 4,356 sq ft lot
Tags
Neighborhood map
What this means for you Summary
Snapshot
- This is a 2-bed/1.0-bath single-family listed at $245k.
Deal economics
- At list price, monthly cash flow is $-165 ($-2k/yr) — negative.
- To cash-flow at today's rent, offer at most $216k (11.9% below list).
- To meet the 1% rule (rent ≥ 1% of price), the offer needs to be $161k (34.4% below list).
- Recommended offer: $161k (34.4% below list) — sets the bar for 1% rule.
- Cap rate 5.5% vs local median 3.2% in Heber-Overgaard — top-decile yield for the area; either an underpriced asset or a hidden risk that comps aren't pricing in. Stress-test before assuming the spread holds.
Location & tenants
- Location reads: area grade D — affects rentability + tenant quality, not the cash-flow math above.
- Heber-Overgaard Unified District (4392) (rural): math 52% / reading 45% proficiency, ranked #51 of 249 in AZ (top 20%) — families likely to look elsewhere, expect single-tenant / working-renter base with shorter leases.
- Market conditions: 254 active listings in the ZIP; 485 units permitted in Navajo County in 2024 (11 in 5+ unit buildings).
Forward outlook
- Local home prices are declining (-3.0%/yr); year-one equity from $2k of loan paydown is wiped out by about $7k of value loss. Plan a longer hold.
- Navajo County population projected at -16% by 2050 — secular population decline; favor cash flow + early exit over multi-decade hold.
Negotiation context
- It's been on market 244 days — a 12% lower offer ($216k) is reasonable based on typical stale-listing flexibility.
- 3 sale attempts since 5y ago with the ask held roughly flat each time — persistent listings suggest the price (not the market) is what's stuck; bring a comps-based counter.
Risks & watch-outs
- Climate carrying-cost: major wildfire risk — expect insurance premiums to compound above CPI over the hold.
Questions for the listing agent
- What do current leases actually rent for vs. the listed asking? Can we see a recent rent roll and the last 12 months of T-12 income?
- It's been on market 244 days. Have you received any prior offers? Is the seller open to a 34% concession, seller financing, or rate buy-down credit?
- Why hasn't it sold? Are there any deal-killer items the seller is aware of (foundation, flood, title, zoning, code violations)?
- Is there a deadline driving the sale (1031 exchange, divorce, estate, relocation)? That informs how much negotiation room exists.
- The area grade is low — what's the realistic commute time and amenity access for the typical tenant pool here? Any planned neighborhood developments (good or bad) we should know about?
- What's the average days-on-market for RENTAL listings here right now (not sales)? A rising rental-DOM trend means longer vacancies and softer asking-rent achievability than the comps imply.
- What's the recent tenant-quality profile in this submarket — average credit score on applications, eviction rate, late-payment / NSF rate, and stable-employment percentage? A property-management company in the area should have these aggregated.
- How much new for-sale + rental construction is in the pipeline within 1–3 miles? Heavy new supply typically softens prices + rents 12–24 months out; constrained supply supports both.
Investment metrics
- 1% rule
- 0.66% ✗
- Cap rate
- 5.48%
- Cash-on-cash
- -2.89%
- DSCR
- 0.87
- GRM
- 12.7
CMA / ARV
- ARV (median comp)
- $293,624
- List price
- $245,000
- Delta
- -16.56%
- Verdict
- UNDERPRICED
- Comps
- 9 within 1.0 mi
Show comp detail 2 sales within ~0.75 mi
| Address | Dist | Beds/Ba | Sqft | Sold | Price | $/sf | Match |
|---|---|---|---|---|---|---|---|
| 3157 Tonto Dr | 0.15mi | 1/1.0 (-1) | 672 (-11%) | 4mo | $215,000 | $320 | 66 |
| 3131 State Route 277 -- | 0.34mi | 2/1.5 | 832 (+10%) | 12mo | $296,500 | $356 | 56 |
Match score weights: distance 35% · size 25% · config 20% · recency 20%. Top-matched comps best support the ARV.
Projected returns pro-forma
-3.0% appreciation · 3.0% rent growth · sell at horizon
- IRR
- -21.2%
- Equity multiple
- 0.27×
- Total profit
- $-50,350
- Equity at exit
- $36,530
- IRR
- -14.9%
- Equity multiple
- 0.16×
- Total profit
- $-57,929
- Equity at exit
- $21,183
Cash invested: $68,600 (down + closing). Projections, not guarantees.
Landlord ↔ Tenant lean methodology
- Overall (STATE)
- 87 Strongly Landlord-Friendly
- State Arizona
- 87 Strongly Landlord-Friendly · R+3
- County
- — inherits STATE
- City
- — inherits STATE
ZIP-level market 85933
- Home prices YoY
- -18.9%
- Active inventory
- 254
- Price-to-rent
- 12.7×
Monthly cashflow live
- Estimated rent
- $1,608 medium interval (Pro) →
- Mortgage (P&I)
- −$1,285
- Tax from tax record
- −$49 /mo · $583/yr
- Insurance
- −$102
- HOA
- −$0
- Vacancy / Maint / Mgmt
- −$338
- Net cashflow
- $-165
Break-even live
UW: 25.0% down · 7.5% · 30yr · 1.5% tax · 5.0% vac · 8.0% maint · 8.0% mgmt
Financing live
Cash to close
- Down payment
- $61,250
- Closing costs
- $7,350
- Reserves months
- —
- Total cash needed
- —
Loan-product check · same deal, 3 products live
Conventional
25% down · 7.5% · 30yr
- Down + closing
- —
- Monthly P&I
- —
- Monthly cashflow
- —
- DSCR
- —
- Eligible?
- —
Personal DTI + credit; lowest rate.
DSCR
20% down · 8.5% · 30yr
- Down + closing
- —
- Monthly P&I
- —
- Monthly cashflow
- —
- DSCR
- —
- Eligible?
- —
No personal income docs; deal must DSCR.
Hard money
10% down · 12.0% · 12mo
- Down + closing
- —
- Monthly P&I
- —
- Monthly cashflow
- —
- DSCR
- —
- Eligible?
- —
Short-term bridge; refi at stabilization.
Listing history 35 events
-
2026-06-19days on market $245,000 Active 244 DOM
-
2026-06-18days on market $245,000 Active 243 DOM
-
2026-06-17days on market $245,000 Active 242 DOM
-
2026-06-16days on market $245,000 Active 241 DOM
-
2026-06-15days on market $245,000 Active 240 DOM
-
2026-06-14days on market $245,000 Active 238 DOM
-
2026-06-12days on market $245,000 Active 237 DOM
-
2026-06-09days on market $245,000 Active 234 DOM
-
2026-06-08days on market $245,000 Active 233 DOM
-
2026-06-07days on market $245,000 Active 232 DOM
-
2026-06-07days on market $245,000 Active 231 DOM
-
2026-06-04days on market $245,000 Active 228 DOM
-
2026-06-02days on market $245,000 Active 227 DOM
-
2026-06-01days on market $245,000 Active 226 DOM
-
2026-05-31days on market $245,000 Active 225 DOM
-
2026-05-31days on market $245,000 Active 224 DOM
-
2025-12-07price $245,000
-
2025-11-12price $249,000
-
2025-11-02price $250,000
-
2025-10-22price $252,000
-
2025-10-22price $258,000
-
2023-10-25soldstatus $229,000 Closed 376-char remark
Show marketing remark (376 chars)
Cozy cabin in the COOL PINES! This little gem won't last long and has everything you need to move right in and start enjoying your cool summer days in HEBER/OVERGAARD! Equipped with Solar you can rest assured that your electric bill will be super low! 2 bed 1 bath with a real wood burning stove in living room! Its close to everything you would ever need! Large spacious lot!
-
2023-10-25soldstatus $229,000
Show marketing remark (376 chars)
Cozy cabin in the COOL PINES! This little gem won't last long and has everything you need to move right in and start enjoying your cool summer days in HEBER/OVERGAARD! Equipped with Solar you can rest assured that your electric bill will be super low! 2 bed 1 bath with a real wood burning stove in living room! Its close to everything you would ever need! Large spacious lot!
-
2023-09-14historical 376-char remark
Show marketing remark (376 chars)
Cozy cabin in the COOL PINES! This little gem won't last long and has everything you need to move right in and start enjoying your cool summer days in HEBER/OVERGAARD! Equipped with Solar you can rest assured that your electric bill will be super low! 2 bed 1 bath with a real wood burning stove in living room! Its close to everything you would ever need! Large spacious lot!
-
2023-09-01price $229,900 376-char remark
Show marketing remark (376 chars)
Cozy cabin in the COOL PINES! This little gem won't last long and has everything you need to move right in and start enjoying your cool summer days in HEBER/OVERGAARD! Equipped with Solar you can rest assured that your electric bill will be super low! 2 bed 1 bath with a real wood burning stove in living room! Its close to everything you would ever need! Large spacious lot!
-
2023-08-04$239,000 Active 376-char remark
Show marketing remark (376 chars)
Cozy cabin in the COOL PINES! This little gem won't last long and has everything you need to move right in and start enjoying your cool summer days in HEBER/OVERGAARD! Equipped with Solar you can rest assured that your electric bill will be super low! 2 bed 1 bath with a real wood burning stove in living room! Its close to everything you would ever need! Large spacious lot!
-
2021-11-17soldstatus $189,900
-
2021-11-17soldstatus $189,900 Closed
-
2021-11-17soldstatus $189,900
-
2021-11-17soldstatus $189,900
-
2021-09-28status Pending
-
2021-07-28price $189,900
-
2021-07-23$194,500 Active
-
2021-07-23$189,900
-
2006-08-31soldstatus $123,800
ⓘ Source: listings_history table (triggers on properties + properties_extension) + one-shot
backfill from property_details.listing_events for pre-trigger history.
Tax reassessment forecast AZ · Resets to sale price
- Current annual tax
- $583 · $49/mo
- Projected year-2 tax
- $1,617 · $135/mo
- Expected delta
- +$1,034/yr (+$86/mo · 177.1%)
ⓘ Screening estimate from a state-policy table — verify with the county assessor before closing.
Climate risk First Street
- Flood 1/10 Low FEMA zone X (unshaded) · 0% chance over 30 yrs
- Wildfire 7/10 Severe
- Heat 2/10 Low 7 d/yr ≥88°F today · 18 d/yr by 30 yrs out
- Wind 1/10 Low
- Air quality 1/10 Low 0 unhealthy d/yr today · 0 by 30 yrs out
Nearby sold comps map
Loading sold comps map…
Walkable amenities ~0.75 mi
Loading nearby amenities…
Taxation est. · year 1
- Rental income
- $19,297
- − Mortgage interest
- −$13,724
- − Property taxes
- −$583
- − Insurance
- −$1,225
- − Repairs & maintenance
- −$1,544
- − Management
- −$1,544
- − Depreciation
- −$7,127
- Taxable loss
- −$6,450
- Est. tax savings @ 24.0%
- +$1,548
- After-tax cash flow
- $-433/yr
For passive investors: Depreciation is non-cash, so a rental often shows a tax loss while cash-flowing — sheltering income. Rental losses are passive: they offset passive income freely, and up to $25,000/yr can offset ordinary (W-2) income if you actively participate and your MAGI is under $100k (phasing out to $0 by $150k); unused losses carry forward. On sale, claimed depreciation is recaptured at up to 25%, and gains may owe capital-gains tax (a 1031 exchange can defer both). Figures are a year-1 estimate at your 24.0% rate — not tax advice; consult a CPA.
Schools (NCES district)
- District
- Heber-Overgaard Unified District (4392)
- NCES district ID
- 0400026
- Math proficiency
- 52% ▼ -5.00%
- Reading proficiency
- 45% ▼ -1.00%
- Median HH income
- $37,916
- Composite
- 40.42/100
- National rank
- #3727
- State rank
- #51 of 249 in AZ
Livability — Heber-Overgaard
No livability data for this city. (Only ~50 U.S. cities are tracked.)
Census & demographics
- Census place
- Heber-Overgaard, AZ
- Population (ZIP)
- 3,989
Population outlook (Navajo County) Hauer SSP2
- Today (2025)
- 105,760 people
- By 2030
- 103,301 · -2.3%
- By 2040
- 97,070 · -8.2%
- By 2050
- 88,850 · -16.0%
- By 2075
- 65,180 · -38.4%
- By 2100
- 37,281 · -64.7%
Race, ethnicity, and origin ACS 2023
- Neighborhood character
- Predominantly White (89%)
- Race & ethnicity
- White 89% Hispanic / Latino 5% Two or more races 4% Native American 3% Asian 2%
- Common ancestry
- Lithuanian 10% Italian 7% Portuguese 3%
- Foreign-born
- 4% · Canada, China
- Languages at home
- 93% English-only · Spanish 2% Other Indo-European 1% Russian/Polish/Slavic 1%
Political lean MEDSL · Navajo
- 2024 margin
- R (+17.2) · D 40.9% · R 58.1%
- 2008→2024 swing
- -5.5pp toward R · 2008: -11.7pp · 2024: -17.2pp
- All cycles
- 2024: R+17.2 2020: R+8.2 2016: R+7.9 2012: R+8.4 2008: R+11.7
Not yet ingested
- Civics
- —
Market trends
- HPI YoY
- ▼ -83.51%
- Current HPI
- 358.021
- Rent YoY
- —
- Metro
- —
- State GDP YoY
- ▲ 4.54%
- F500 in state
- 20
Industry mix (Fortune 500 HQ in AZ)
| Industry | F500 HQs | Revenue |
|---|---|---|
| Technology | 2 | $13B |
|
||
| Mining / Metals | 1 | $23B |
|
||
| Environmental Services | 1 | $16B |
|
||
| Metals / Steel | 1 | $14B |
|
||
| Technology Distribution | 1 | $9B |
|
||
| Homebuilding | 1 | $8B |
|
||
Price history
+97.9% since first listed19 events — show timeline
- 2025-12-07 Price Changed $245,000 WMMLS
- 2025-11-12 Price Changed $249,000 WMMLS
- 2025-11-02 Price Changed $250,000 WMMLS
- 2025-10-22 Price Changed $252,000 WMMLS
- 2025-10-22 Price Changed $258,000 WMMLS
- 2023-10-25 Sold (Public Records) $229,000 Public Records
- 2023-10-25 Sold (MLS) $229,000 WMMLS
- 2023-09-14 Delisted — WMMLS
- 2023-09-01 Price Changed $229,900 WMMLS
- 2023-08-04 Listed $239,000 WMMLS
- 2021-11-17 Sold (Public Records) $189,900 Public Records
- 2021-11-17 Sold (MLS) $189,900 CAAR
- 2021-11-17 Sold (MLS) $189,900 ARMLS
- 2021-11-17 Sold (MLS) $189,900 WMMLS
- 2021-09-28 Pending — ARMLS
- 2021-07-28 Price Changed $189,900 ARMLS
- 2021-07-23 Listed $189,900 CAAR
- 2021-07-23 Listed $194,500 ARMLS
- 2006-08-31 Sold (Public Records) $123,800 Public Records
Property tax history
+0.6%/yrLatest (2025): $583 · +1.5% YoY. Source: county tax records.
Cash-flow waterfall
monthlySold comps — $/sqft
last 12 mo · ≤1 miLoading sold comps…