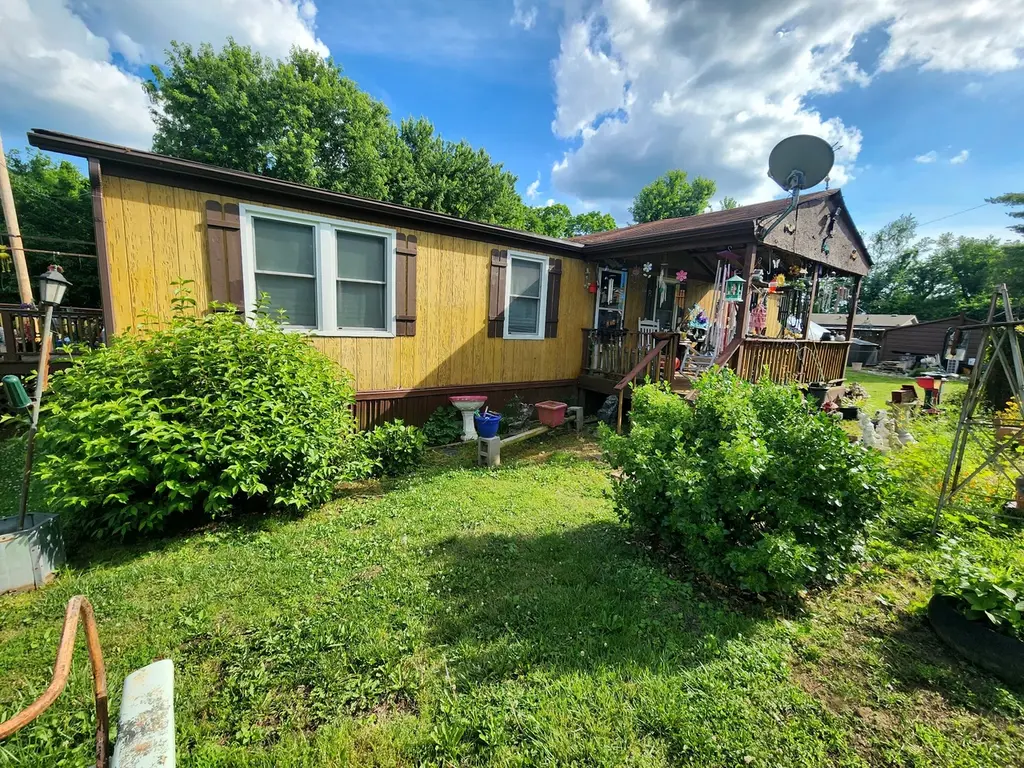
2791 Nunley St
Greenbrier, TN 37073
$215,000C-
3 bd · 2.0 ba ·
1,248 sqft ·
Built 1993
· Manufactured
· Active
· 20 DOM
Cashflow @ list (25.0% down · 7.5%)
Estimated rent
$2,123/mo
Mortgage (P&I)
−$1,127
Tax + insurance
−$188
HOA
−$0
Vac / Maint / Mgmt
−$446
Net cashflow
$362/mo
Annual
$4,341/yr
Cap rate
8.31%
Cash-on-cash
7.21%
DSCR
1.32
1% rule
0.99%
Cash to close
$60,200
Investor read
- This is a 3-bed/2.0-bath manufactured listed at $215k.
- At list price, monthly cash flow is $362 ($4k/yr) — positive.
- The deal already cash-flows at list — no discount required.
- To meet the 1% rule (rent ≥ 1% of price), the offer needs to be $212k (1.3% below list).
- It's been on market 20 days — a 2% lower offer ($212k) is reasonable based on typical stale-listing flexibility.
- Recommended offer: $212k (1.5% below list) — sets the bar for market timing.
- Local home prices are declining (-3.0%/yr); year-one equity from $1k of loan paydown is wiped out by about $6k of value loss. Plan a longer hold.
- Location reads 63/100 on livability (#187 in TN) — a middle-class / working-renter tenant base. Strengths: crime A+, cost of living A+, housing A+; Watch: amenities F, commute F, health & safety F.
- Robertson County (rural): math 22% / reading 26% proficiency, ranked #82 of 139 in TN (top 59%) — low school quality limits family demand, transient renter base, plan for 1-2y turnover.
- Zoned schools: Greenbrier Elementary (math 41% / reading 36%, grade F, #260 of 952 statewide, top 28%, 624 students, 0% FRL); Greenbrier High School (math 15% / reading 22%, grade F, #208 of 332 statewide, top 63%, 812 students, 0% FRL) — zoned schools average 0% FRL vs 42% district-wide (42 pts lower); this property's tenant base skews higher-income than the district average.
- Market conditions: 122 active listings in the ZIP; 3 comparable units currently listed for rent nearby; rentals leasing fast (median 8d on market — plan ~1-2 weeks tenant-placement turnaround); 983 units permitted in Robertson County in 2024 (0 in 5+ unit buildings).
- Robertson County population projected at +7% by 2050 — modest demand growth; plan on rents tracking national, not racing it.
- Climate carrying-cost: extreme-heat days projected 7→20/yr by 2055 (HVAC capex compounding) — expect insurance premiums to compound above CPI over the hold.
- Cap rate 8.3% vs local median 3.4% in Greenbrier — top-decile yield for the area; either an underpriced asset or a hidden risk that comps aren't pricing in. Stress-test before assuming the spread holds.
Questions for listing agent
- Is there a deadline driving the sale (1031 exchange, divorce, estate, relocation)? That informs how much negotiation room exists.
- Schools are F-rated, which usually means shorter tenancies and higher turnover. Who's the typical renter profile here, and what's been the actual vacancy rate?
- What's the average days-on-market for RENTAL listings here right now (not sales)? A rising rental-DOM trend means longer vacancies and softer asking-rent achievability than the comps imply.
- What's the recent tenant-quality profile in this submarket — average credit score on applications, eviction rate, late-payment / NSF rate, and stable-employment percentage? A property-management company in the area should have these aggregated.
- How much new for-sale + rental construction is in the pipeline within 1–3 miles? Heavy new supply typically softens prices + rents 12–24 months out; constrained supply supports both.
CashFlowRE · CFR-Q44KB4AB2RHJBK
· Data 2 days ago
cashflowre.app · 2026-05-29