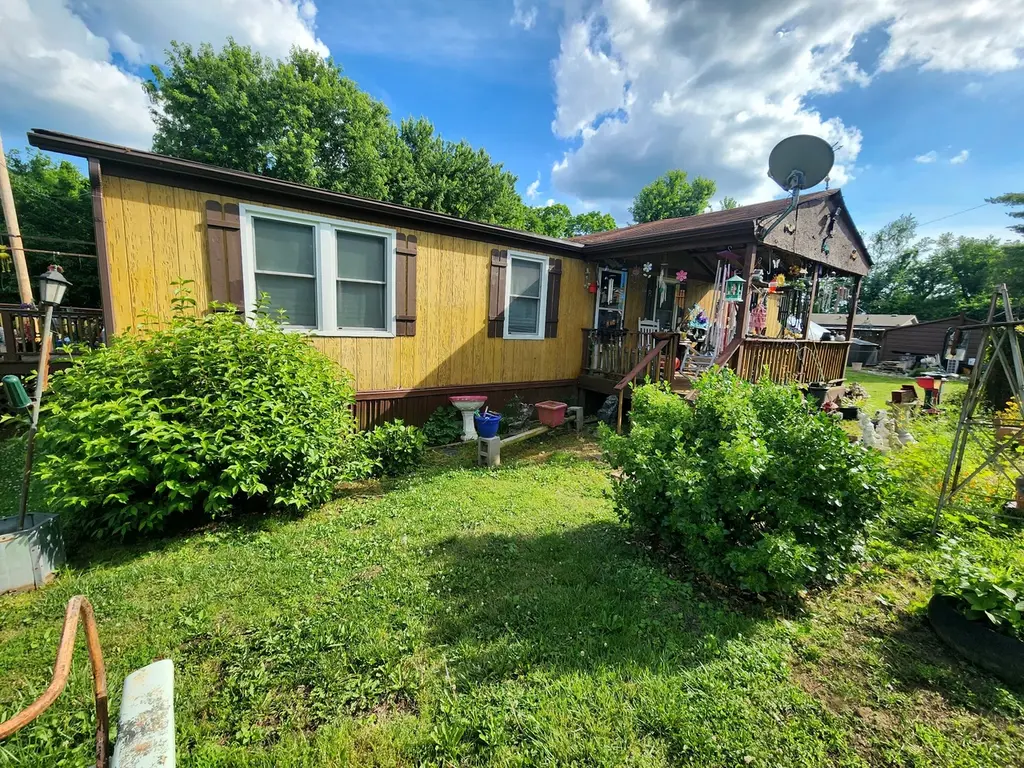
2791 Nunley St · Greenbrier, TN
Flood risk 1/10 · Minimal
- FEMA flood zone
- X (unshaded)
- Chance of flooding over 30 yrs
- 0.0%
- Est. flood insurance / yr
- $507 – $1,088
Fire risk 4/10 · Minor
- Est. fire insurance / yr
- $949 – $1,763
Heat risk 5/10 · Moderate
- Hot days now (above 105°F)
- 7 days/yr
- Hot days in 30 yrs
- 20 days/yr
Wind risk 4/10 · Minor
- Chance of severe wind over 30 yrs
- 8.0%
Air-quality risk 2/10 · Minimal
- Unhealthy air days now
- 0 days/yr
- Unhealthy air days in 30 yrs
- 1 days/yr
Risk factors via First Street. Map © Google.
Why this score? — see what drove the C- grade
The composite is a weighted blend of 9 inputs, each scored 0–100. Each bar is that input's sub-score; the figure is the points it added to the 100-point composite (weight × sub-score).
- Cash flow +22.5/30.0
- ARV discount +8.5/15.0
- DSCR +7.2/10.0
- 1% rule +4.9/10.0
- Livability +3.2/5.0
- Rent growth +2.5/5.0
- Condition / age +2.5/5.0
- Schools +2.2/10.0
- Appreciation +0.0/10.0
$215,000
🖨 Deal sheet 📄 Offer letter ✓ Due diligence
Listing remarks
Cute 3 bedroom 2 bathroom home with 1,248 sq ft. With a comfortable layout and plenty of character this home is ready for your personal touches to make it truly your own. Additional opportunity available - adjoining lot with home may also be purchased. Red & Light brown shed will NOT stay. Home is anchored with block pillars but has underpinning - I do have a mortgage company who CAN finance!
Key facts
- 0.24 acre lot
- Built 1993
- Listed 20 days
Property features AI
Finance
- Other: Living area reported as 1,248 square feet
Exterior
- Parking: No covered parking listed; No total parking spaces listed
- Utilities: Public water; Public sewer
- Home design: Residential mobile home; Single-story
- Construction: Built (existing); Construction materials: Other
- Exterior features: Lot about 0.24 acre (approx. 79 x 128.44 irregular); Water available
Interior
- Kitchen: Kitchen approx. 12 x 11; Electric range, Dishwasher, Refrigerator
- Bedrooms: 3 bedrooms (all on the main level); Primary bedroom approx. 13 x 11; Second bedroom approx. 11 x 10; Third bedroom approx. 11 x 10
- Flooring: Carpet; Laminate
- Bathrooms: 2 full bathrooms; Primary bedroom includes a full bath
- Heating & cooling: Central heating; Central air conditioning
- Interior features: No basement; Electric range, Dishwasher, Refrigerator
Neighborhood map
What this means for you Summary
Snapshot
- This is a 3-bed/2.0-bath manufactured listed at $215k.
Deal economics
- At list price, monthly cash flow is $362 ($4k/yr) — positive.
- The deal already cash-flows at list — no discount required.
- To meet the 1% rule (rent ≥ 1% of price), the offer needs to be $212k (1.3% below list).
- Recommended offer: $212k (1.5% below list) — sets the bar for market timing.
- Cap rate 8.3% vs local median 3.4% in Greenbrier — top-decile yield for the area; either an underpriced asset or a hidden risk that comps aren't pricing in. Stress-test before assuming the spread holds.
Location & tenants
- Location reads 63/100 on livability (#187 in TN) — a middle-class / working-renter tenant base. Strengths: crime A+, cost of living A+, housing A+; Watch: amenities F, commute F, health & safety F.
- Robertson County (rural): math 22% / reading 26% proficiency, ranked #82 of 139 in TN (top 59%) — low school quality limits family demand, transient renter base, plan for 1-2y turnover.
- Zoned schools: Greenbrier Elementary (math 41% / reading 36%, grade F, #260 of 952 statewide, top 28%, 624 students, 0% FRL); Greenbrier High School (math 15% / reading 22%, grade F, #208 of 332 statewide, top 63%, 812 students, 0% FRL) — zoned schools average 0% FRL vs 42% district-wide (42 pts lower); this property's tenant base skews higher-income than the district average.
- Market conditions: 122 active listings in the ZIP; 3 comparable units currently listed for rent nearby; rentals leasing fast (median 8d on market — plan ~1-2 weeks tenant-placement turnaround); 983 units permitted in Robertson County in 2024 (0 in 5+ unit buildings).
Forward outlook
- Local home prices are declining (-3.0%/yr); year-one equity from $1k of loan paydown is wiped out by about $6k of value loss. Plan a longer hold.
- Robertson County population projected at +7% by 2050 — modest demand growth; plan on rents tracking national, not racing it.
Negotiation context
- It's been on market 20 days — a 2% lower offer ($212k) is reasonable based on typical stale-listing flexibility.
Risks & watch-outs
- Climate carrying-cost: extreme-heat days projected 7→20/yr by 2055 (HVAC capex compounding) — expect insurance premiums to compound above CPI over the hold.
Questions for the listing agent
- Is there a deadline driving the sale (1031 exchange, divorce, estate, relocation)? That informs how much negotiation room exists.
- Schools are F-rated, which usually means shorter tenancies and higher turnover. Who's the typical renter profile here, and what's been the actual vacancy rate?
- What's the average days-on-market for RENTAL listings here right now (not sales)? A rising rental-DOM trend means longer vacancies and softer asking-rent achievability than the comps imply.
- What's the recent tenant-quality profile in this submarket — average credit score on applications, eviction rate, late-payment / NSF rate, and stable-employment percentage? A property-management company in the area should have these aggregated.
- How much new for-sale + rental construction is in the pipeline within 1–3 miles? Heavy new supply typically softens prices + rents 12–24 months out; constrained supply supports both.
Investment metrics
- 1% rule
- 0.99% ✗
- Cap rate
- 8.31%
- Cash-on-cash
- 7.21%
- DSCR
- 1.32
- GRM
- 8.4
CMA / ARV
- ARV (on-the-fly)
- $219,648
- Comps found
- 1
Show comp detail 1 sale within ~0.75 mi
| Address | Dist | Beds/Ba | Sqft | Sold | Price | $/sf | Match |
|---|---|---|---|---|---|---|---|
| 2555 Nunley St | 0.23mi | 3/2.0 | 1,224 (-2%) | 8mo | $215,000 | $176 | 80 |
Match score weights: distance 35% · size 25% · config 20% · recency 20%. Top-matched comps best support the ARV.
Projected returns pro-forma
-3.0% appreciation · 3.0% rent growth · sell at horizon
- IRR
- -5.3%
- Equity multiple
- 0.80×
- Total profit
- $-11,870
- Equity at exit
- $32,057
- IRR
- 4.3%
- Equity multiple
- 1.32×
- Total profit
- $19,040
- Equity at exit
- $18,589
Cash invested: $60,200 (down + closing). Projections, not guarantees.
Landlord ↔ Tenant lean methodology
- Overall (STATE)
- 87 Strongly Landlord-Friendly
- State Tennessee
- 87 Strongly Landlord-Friendly · R+13
- County
- — inherits STATE
- City
- — inherits STATE
ZIP-level market 37073
- Home prices YoY
- -24.7%
- Active inventory
- 122
- Price-to-rent
- 8.4×
Monthly cashflow live
- Estimated rent
- $2,123 medium interval (Pro) →
- Mortgage (P&I)
- −$1,127
- Tax from tax record
- −$98 /mo · $1,180/yr
- Insurance
- −$90
- HOA
- −$0
- Vacancy / Maint / Mgmt
- −$446
- Net cashflow
- $362
Break-even live
UW: 25.0% down · 7.5% · 30yr · 1.5% tax · 5.0% vac · 8.0% maint · 8.0% mgmt
Financing live
Cash to close
- Down payment
- $53,750
- Closing costs
- $6,450
- Reserves months
- —
- Total cash needed
- —
Loan-product check · same deal, 3 products live
Conventional
25% down · 7.5% · 30yr
- Down + closing
- —
- Monthly P&I
- —
- Monthly cashflow
- —
- DSCR
- —
- Eligible?
- —
Personal DTI + credit; lowest rate.
DSCR
20% down · 8.5% · 30yr
- Down + closing
- —
- Monthly P&I
- —
- Monthly cashflow
- —
- DSCR
- —
- Eligible?
- —
No personal income docs; deal must DSCR.
Hard money
10% down · 12.0% · 12mo
- Down + closing
- —
- Monthly P&I
- —
- Monthly cashflow
- —
- DSCR
- —
- Eligible?
- —
Short-term bridge; refi at stabilization.
Rent comps 3 comps
| Address | Beds | Baths | Sqft | Rent | $/sqft | DOM | Units | Dist |
|---|---|---|---|---|---|---|---|---|
| 1022 W College St Unit 2 Greenbrier, TN | 3.0 | 2.0 | 1120 | $2,400 | $2.14 | 4d | 1 | 0.44mi |
| 2126 Nunley St Greenbrier, TN | 3.0 | 2.0 | 1462 | $1,600 | $1.09 | 7d | 1 | 0.71mi |
| 2017 Smith Cir Greenbrier, TN | 3.0 | 2.0 | 1442 | $2,200 | $1.53 | 7d | 1 | 1.10mi |
Listing history 17 events
-
2026-06-18days on market $215,000 Active 20 DOM
-
2026-06-17days on market $215,000 Active 19 DOM
-
2026-06-16days on market $215,000 Active 18 DOM
-
2026-06-15pricedays on market $215,000 Active 17 DOM
-
2026-06-13days on market $225,000 Active 15 DOM
-
2026-06-13days on market $225,000 Active 14 DOM
-
2026-06-09days on market $225,000 Active 11 DOM
-
2026-06-08days on market $225,000 Active 10 DOM
-
2026-06-07remarks 397-char remark
-
2026-06-07days on market $225,000 Active 9 DOM
-
2026-06-03days on market $225,000 Active 5 DOM
-
2026-06-02days on market $225,000 Active 4 DOM
-
2026-06-01days on market $225,000 Active 3 DOM
-
2026-05-31days on market $225,000 Active 2 DOM
-
2026-05-29$225,000 Active
-
2026-03-02historical
-
2026-03-01historical
ⓘ Source: listings_history table (triggers on properties + properties_extension) + one-shot
backfill from property_details.listing_events for pre-trigger history.
Tax reassessment forecast TN · Resets to sale price
- Current annual tax
- $1,180 · $98/mo
- Projected year-2 tax
- $1,526 · $127/mo
- Expected delta
- +$346/yr (+$29/mo · 29.4%)
ⓘ Screening estimate from a state-policy table — verify with the county assessor before closing.
Climate risk First Street
- Flood 1/10 Low FEMA zone X (unshaded) · 0% chance over 30 yrs
- Wildfire 4/10 Moderate
- Heat 5/10 Major 7 d/yr ≥105°F today · 20 d/yr by 30 yrs out
- Wind 4/10 Moderate 8% chance of damaging wind over 30 yrs
- Air quality 2/10 Low 0 unhealthy d/yr today · 1 by 30 yrs out
Nearby sold comps map
Loading sold comps map…
Walkable amenities ~0.75 mi
Loading nearby amenities…
Taxation est. · year 1
- Rental income
- $25,476
- − Mortgage interest
- −$12,043
- − Property taxes
- −$1,180
- − Insurance
- −$1,075
- − Repairs & maintenance
- −$2,038
- − Management
- −$2,038
- − Depreciation
- −$6,255
- Taxable income
- $847
- Est. tax owed @ 24.0%
- −$203
- After-tax cash flow
- $4,138/yr
For passive investors: Depreciation is non-cash, so a rental often shows a tax loss while cash-flowing — sheltering income. Rental losses are passive: they offset passive income freely, and up to $25,000/yr can offset ordinary (W-2) income if you actively participate and your MAGI is under $100k (phasing out to $0 by $150k); unused losses carry forward. On sale, claimed depreciation is recaptured at up to 25%, and gains may owe capital-gains tax (a 1031 exchange can defer both). Figures are a year-1 estimate at your 24.0% rate — not tax advice; consult a CPA.
Schools (NCES district)
- District
- Robertson County
- NCES district ID
- 4703600
- Math proficiency
- 22% ▼ -11.00%
- Reading proficiency
- 26% ▼ -5.00%
- Median HH income
- $53,503
- Composite
- 21.55/100
- National rank
- #8313
- State rank
- #82 of 139 in TN
Livability — Greenbrier
- Score
- 63/100
- State rank
- #187
- US rank
- #15098
Category grades
Schools grade is shown separately in the Schools card above.
Census & demographics
- Census place
- Greenbrier, TN
- City population
- 14,312
- Population (ZIP)
- 14,312
Population outlook (Robertson County) Hauer SSP2
- Today (2025)
- 72,786 people
- By 2030
- 74,478 · +2.3%
- By 2040
- 76,948 · +5.7%
- By 2050
- 77,618 · +6.6%
- By 2075
- 77,545 · +6.5%
- By 2100
- 72,836 · +0.1%
Race, ethnicity, and origin ACS 2023
- Neighborhood character
- Predominantly White (93%)
- Race & ethnicity
- White 93% Hispanic / Latino 4% Two or more races 2%
- Common ancestry
- Slovak 3% Italian 2% Scotch-Irish 2%
- Foreign-born
- 2% · Canada, South Korea
- Languages at home
- 97% English-only · Spanish 2% Korean 1%
Political lean MEDSL · Robertson
- 2024 margin
- Solid R (+50.9) · D 24.0% · R 74.9% · Other 1.1%
- 2008→2024 swing
- -19.8pp toward R · 2008: -31.1pp · 2024: -50.9pp
- All cycles
- 2024: R+50.9 2020: R+47.0 2016: R+47.2 2012: R+35.6 2008: R+31.1
Not yet ingested
- Civics
- —
Market trends
- HPI YoY
- ▼ -96.44%
- Current HPI
- 293.5595
- Rent YoY
- —
- Metro
- —
- State GDP YoY
- ▲ 2.78%
- F500 in state
- 22
Industry mix (Fortune 500 HQ in TN)
| Industry | F500 HQs | Revenue |
|---|---|---|
| Healthcare | 3 | $91B |
|
||
| Retail | 3 | $72B |
|
||
| Transportation / Logistics | 1 | $88B |
|
||
| Paper / Packaging | 1 | $19B |
|
||
| Insurance | 1 | $13B |
|
||
| Energy | 1 | $12B |
|
||
Price history
3 events — show timeline
- 2026-05-29 Listed $225,000 REALTRACS as Distributed by MLS Grid
- 2026-03-02 Coming Soon — REALTRACS as Distributed by MLS Grid
- 2026-03-01 Listing Removed — REALTRACS as Distributed by MLS Grid
Property tax history
+5.8%/yrLatest (2025): $1,180 · +0.0% YoY. Source: county tax records.
Cash-flow waterfall
monthlySold comps — $/sqft
last 12 mo · ≤1 miLoading sold comps…