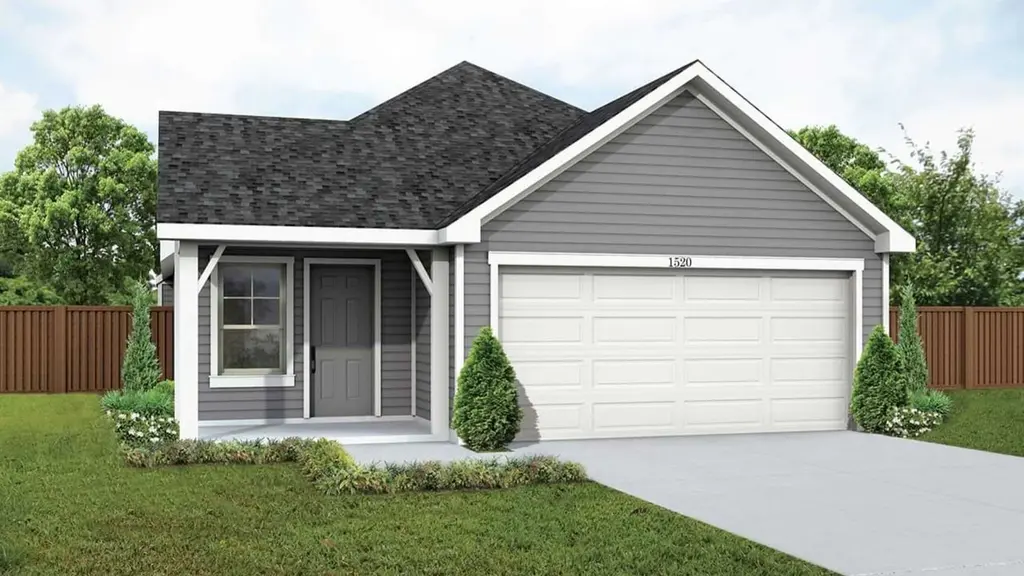
Horizon Plan
Magnolia, TX 77354
$247,990D+
3 bd · 2.0 ba ·
1,520 sqft ·
Built —
· SingleFamily
· Active
· 246 DOM
Cashflow @ list (25.0% down · 7.5%)
Estimated rent
$2,069/mo
Mortgage (P&I)
−$1,386
Tax + insurance
−$440
HOA
−$0
Vac / Maint / Mgmt
−$434
Net cashflow
$-192/mo
Annual
$-2,302/yr
Cap rate
5.42%
Cash-on-cash
-3.11%
DSCR
0.86
1% rule
0.78%
Cash to close
$73,992
Investor read
- This is a 3-bed/2.0-bath single-family listed at $248k. Condition is rated good.
- At list price, monthly cash flow is $-192 ($-2k/yr) — negative.
- To cash-flow at today's rent, offer at most $236k (4.6% below list).
- To meet the 1% rule (rent ≥ 1% of price), the offer needs to be $207k (16.6% below list).
- It's been on market 246 days — a 12% lower offer ($218k) is reasonable based on typical stale-listing flexibility.
- Recommended offer: $207k (16.6% below list) — sets the bar for 1% rule.
- In year one you build about $28k of equity ($2k loan paydown + $26k appreciation (10.0% local appreciation)).
- Location reads 73/100 on livability (#222 in TX) — a middle-class / working-renter tenant base. Strengths: crime A+, cost of living A+, housing A+; Watch: schools D+, amenities F, commute F.
- Magnolia ISD (rural): math 42% / reading 45% proficiency, ranked #247 of 826 in TX (top 30%) — families likely to look elsewhere, expect single-tenant / working-renter base with shorter leases.
- Market conditions: Rents flat; 1604 active listings in the ZIP; 4 comparable units currently listed for rent nearby; rentals leasing fast (median 11d on market — plan ~1-2 weeks tenant-placement turnaround); high-income renter base; 13,259 units permitted in Montgomery County in 2024 (1,402 in 5+ unit buildings).
- Montgomery County population projected at +65% by 2050 — long-run rental-demand tailwind backs the buy-and-hold thesis.
- By year 2, paydown + projected appreciation supports a ~$45k cash-out refi (75% LTV) — recoverable capital for the next deal without selling this one.
- Cap rate 5.4% vs local median 3.4% in Magnolia — top-decile yield for the area; either an underpriced asset or a hidden risk that comps aren't pricing in. Stress-test before assuming the spread holds.
Questions for listing agent
- What do current leases actually rent for vs. the listed asking? Can we see a recent rent roll and the last 12 months of T-12 income?
- It's been on market 246 days. Have you received any prior offers? Is the seller open to a 17% concession, seller financing, or rate buy-down credit?
- Why hasn't it sold? Are there any deal-killer items the seller is aware of (foundation, flood, title, zoning, code violations)?
- Is there a deadline driving the sale (1031 exchange, divorce, estate, relocation)? That informs how much negotiation room exists.
- Schools are D-rated, which usually means shorter tenancies and higher turnover. Who's the typical renter profile here, and what's been the actual vacancy rate?
- The area grade is low — what's the realistic commute time and amenity access for the typical tenant pool here? Any planned neighborhood developments (good or bad) we should know about?
- What's the average days-on-market for RENTAL listings here right now (not sales)? A rising rental-DOM trend means longer vacancies and softer asking-rent achievability than the comps imply.
- What's the recent tenant-quality profile in this submarket — average credit score on applications, eviction rate, late-payment / NSF rate, and stable-employment percentage? A property-management company in the area should have these aggregated.
CashFlowRE · CFR-Q4AWF91DG00PKP
· Data 2 days ago
cashflowre.app · 2026-05-29