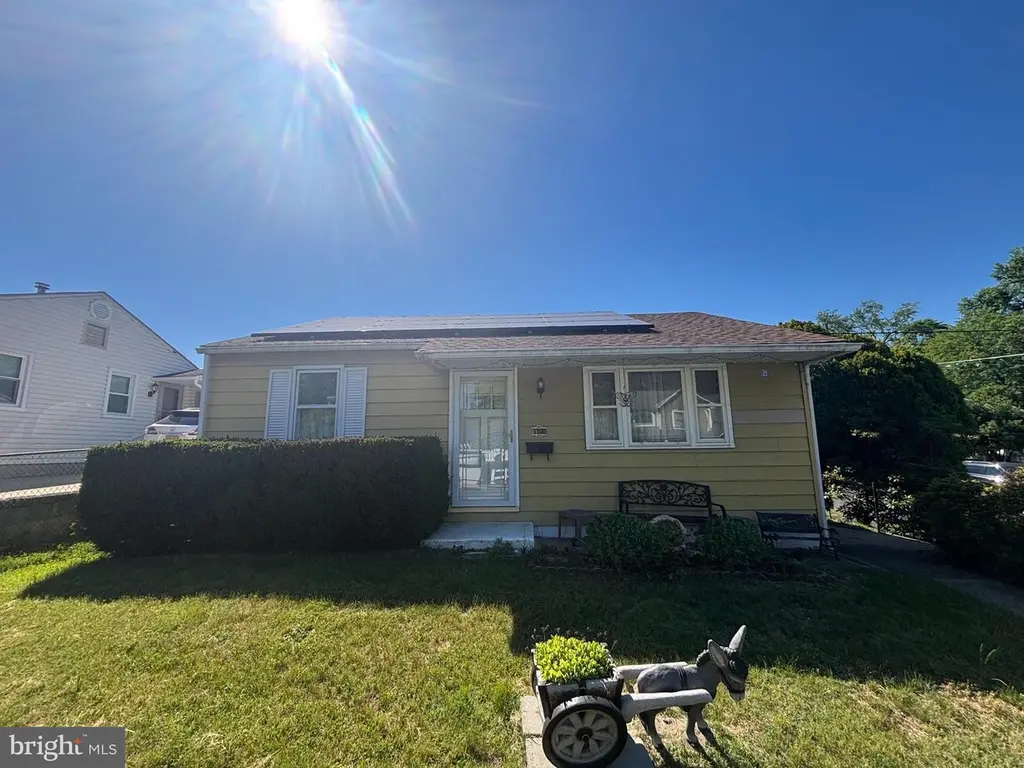
1100 Scott Ave
Lindenwold, NJ 08021
$125,000C+
2 bd · 1.0 ba ·
720 sqft ·
Built 1954
· SingleFamily
· Pending
· 4 DOM
Cashflow @ list (25.0% down · 7.5%)
Estimated rent
$1,607/mo
Mortgage (P&I)
−$656
Tax + insurance
−$410
HOA
−$0
Vac / Maint / Mgmt
−$338
Net cashflow
$204/mo
Annual
$2,446/yr
Cap rate
8.25%
Cash-on-cash
6.99%
DSCR
1.31
1% rule
1.29%
Cash to close
$35,000
Investor read
- This is a 2-bed/1.0-bath single-family listed at $125k.
- At list price, monthly cash flow is $204 ($2k/yr) — positive.
- The deal already cash-flows at list — no discount required.
- Meets the 1% rule at list price ($2k rent vs $125k).
- Only 4 days on market — expect competitive offers; lowballing is unlikely to land.
- Local home prices are declining (-3.0%/yr); year-one equity from $864 of loan paydown is wiped out by about $4k of value loss. Plan a longer hold.
- Location reads 68/100 on livability (#312 in NJ) — a middle-class / working-renter tenant base. Strengths: housing A+, health & safety A, cost of living B; Watch: employment C-, crime D, amenities D-.
- Lindenwold Public School District (suburban): math 4% / reading 25% proficiency, ranked #461 of 472 in NJ (top 98%) — low school quality limits family demand, transient renter base, plan for 1-2y turnover; 68% free/reduced lunch — lower-income household profile, screen leases tightly.
- Zoned schools: Lindenwold School Five (math 7% / reading 20%, grade F, #1,152 of 1,303 statewide, top 89%, 593 students, 82% FRL); Lindenwold Middle School (math 3% / reading 26%, grade F, #418 of 431 statewide, top 97%, 911 students, 88% FRL); Lindenwold High School (math 2% / reading 37%, grade F, #354 of 399 statewide, top 89%, 727 students, 80% FRL) — zoned schools average 83% FRL vs 68% district-wide (15 pts higher); higher-poverty schools than district average — tighter screening recommended.
- Watch-outs: property tax is 3.4% of price; built in 1954 — expect roof / HVAC / electrical / plumbing capex.
- Market conditions: Rents rising (+3.0%/yr); 242 active listings in the ZIP; 13 comparable units currently listed for rent nearby; rentals leasing fast (median 7d on market — plan ~1-2 weeks tenant-placement turnaround); 1,018 units permitted in Camden County in 2024 (509 in 5+ unit buildings).
- Camden County population projected to shrink 8% by 2050 — rents likely to lag national; underwrite the cash flow, not the appreciation.
- Current owner paid $45k; list at $125k implies a 178% gain — meaningful room to come down on a strong offer.
- Climate carrying-cost: major wind risk, 61% chance of damaging wind over 30y; extreme-heat days projected 7→15/yr by 2055 (HVAC capex compounding) — expect insurance premiums to compound above CPI over the hold.
- Cap rate 8.2% vs local median 5.2% in Lindenwold — top-decile yield for the area; either an underpriced asset or a hidden risk that comps aren't pricing in. Stress-test before assuming the spread holds.
Questions for listing agent
- Built in 1954 — when were the roof, HVAC, electrical panel, plumbing, and water heater last replaced?
- Property tax is high relative to price — has the assessment been appealed recently, and will the sale trigger a re-assessment?
- Is there a deadline driving the sale (1031 exchange, divorce, estate, relocation)? That informs how much negotiation room exists.
- Schools are F-rated, which usually means shorter tenancies and higher turnover. Who's the typical renter profile here, and what's been the actual vacancy rate?
- Crime grade is D in this area — have there been break-ins, vandalism, or insurance claims at this property in the last 3 years? What carrier currently insures it and at what premium?
- What's the average days-on-market for RENTAL listings here right now (not sales)? A rising rental-DOM trend means longer vacancies and softer asking-rent achievability than the comps imply.
- What's the recent tenant-quality profile in this submarket — average credit score on applications, eviction rate, late-payment / NSF rate, and stable-employment percentage? A property-management company in the area should have these aggregated.
- How much new for-sale + rental construction is in the pipeline within 1–3 miles? Heavy new supply typically softens prices + rents 12–24 months out; constrained supply supports both.
CashFlowRE · CFR-Q50S98AMGB3R08
· Data 1 week ago
cashflowre.app · 2026-05-29