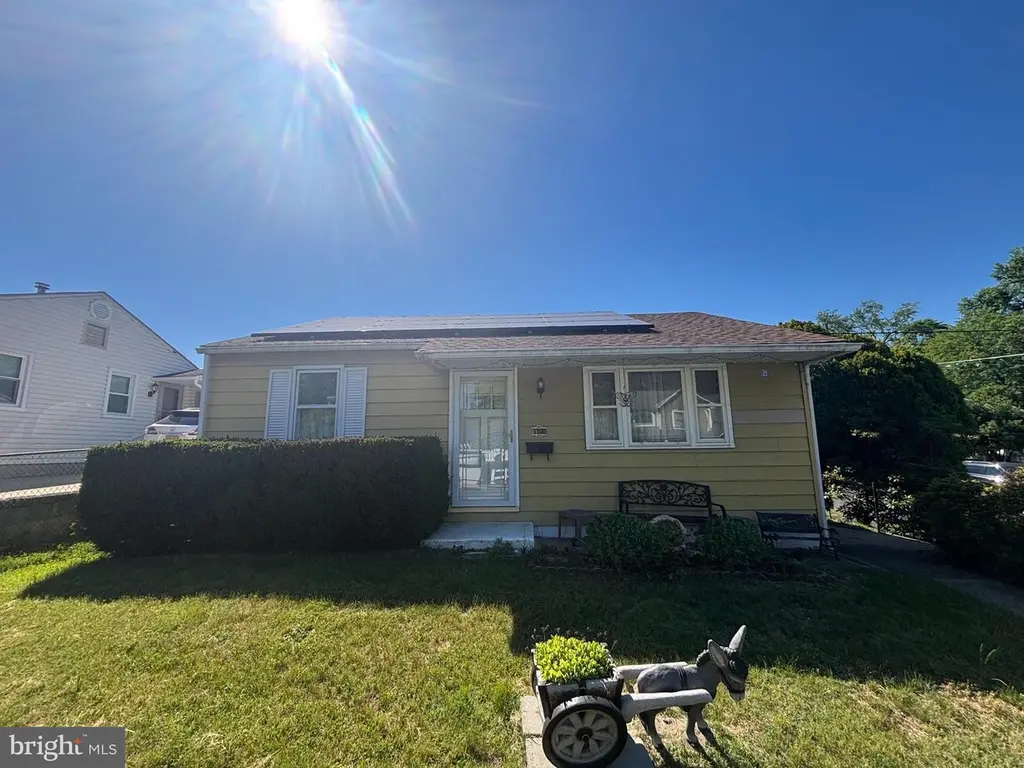
1100 Scott Ave · Lindenwold, NJ
Flood risk 1/10 · Minimal
- FEMA flood zone
- X (unshaded)
- Chance of flooding over 30 yrs
- 0.0%
- Est. flood insurance / yr
- $507 – $1,088
Fire risk 2/10 · Minimal
- Est. fire insurance / yr
- $526 – $976
Heat risk 7/10 · Major
- Hot days now (above 103°F)
- 7 days/yr
- Hot days in 30 yrs
- 15 days/yr
Wind risk 6/10 · Moderate
- Chance of severe wind over 30 yrs
- 61.0%
Air-quality risk 3/10 · Minor
- Unhealthy air days now
- 3 days/yr
- Unhealthy air days in 30 yrs
- 3 days/yr
Risk factors via First Street. Map © Google.
Why this score? — see what drove the C+ grade
The composite is a weighted blend of 9 inputs, each scored 0–100. Each bar is that input's sub-score; the figure is the points it added to the 100-point composite (weight × sub-score).
- Cash flow +22.2/30.0
- ARV discount +15.0/15.0
- 1% rule +7.9/10.0
- DSCR +7.1/10.0
- Livability +3.4/5.0
- Rent growth +3.3/5.0
- Condition / age +2.5/5.0
- Schools +1.3/10.0
- Appreciation +0.0/10.0
$125,000
🖨 Deal sheet (PDF) 📄 Offer letter ✓ Due diligence
Listing remarks
Welcome home! Featuring a spacious corner lot, this 2-bedroom, 1-bath rancher is packed with potential. The property features a large gated driveway, multiple storage sheds, a nice pool, and solar panels for energy efficiency. While the interior is waiting for your personal touch and updates, you truly cannot beat this value. Schedule your tour today and see the possibilities! Can send interior photos upon request. Being sold strictly in as-is condition, offering an incredible value for the right buyer as it is priced accordingly. Be sure to book your showing today!
Key facts
- Gated driveway
- Solar panels
- Corner lot
Tags
Property features AI
Exterior
- Parking: Driveway parking for 5 vehicles (total 5 garage/parking spaces listed)
- Utilities: Public water; Public sewer; Electric cooling fuel; Natural gas for heating and hot water; PV solar array(s) leased
- Home design: Detached structure; Frame construction
- Construction: Built year recorded by assessor; Frame construction; Concrete perimeter foundation
- Exterior features: Personal pool; Lot dimensions approximately 50 x 100
Interior
- Bedrooms: 2 bedrooms on the main level
- Bathrooms: 1 full bathroom on the main level
- Heating & cooling: Forced air heating (natural gas); Central air conditioning and window units; Natural gas hot water
- Interior features: No basement; Living area measured by assessor
Neighborhood map
What this means for you Summary
Snapshot
- This is a 2-bed/1.0-bath single-family listed at $125k.
Deal economics
- At list price, monthly cash flow is $204 ($2k/yr) — positive.
- The deal already cash-flows at list — no discount required.
- Meets the 1% rule at list price ($2k rent vs $125k).
- Cap rate 8.2% vs local median 5.2% in Lindenwold — top-decile yield for the area; either an underpriced asset or a hidden risk that comps aren't pricing in. Stress-test before assuming the spread holds.
Location & tenants
- Location reads 68/100 on livability (#312 in NJ) — a middle-class / working-renter tenant base. Strengths: housing A+, health & safety A, cost of living B; Watch: employment C-, crime D, amenities D-.
- Lindenwold Public School District (suburban): math 4% / reading 25% proficiency, ranked #461 of 472 in NJ (top 98%) — low school quality limits family demand, transient renter base, plan for 1-2y turnover; 68% free/reduced lunch — lower-income household profile, screen leases tightly.
- Zoned schools: Lindenwold School Five (math 7% / reading 20%, grade F, #1,152 of 1,303 statewide, top 89%, 593 students, 82% FRL); Lindenwold Middle School (math 3% / reading 26%, grade F, #418 of 431 statewide, top 97%, 911 students, 88% FRL); Lindenwold High School (math 2% / reading 37%, grade F, #354 of 399 statewide, top 89%, 727 students, 80% FRL) — zoned schools average 83% FRL vs 68% district-wide (15 pts higher); higher-poverty schools than district average — tighter screening recommended.
- Market conditions: Rents rising (+3.0%/yr); 242 active listings in the ZIP; 13 comparable units currently listed for rent nearby; rentals leasing fast (median 7d on market — plan ~1-2 weeks tenant-placement turnaround); 1,018 units permitted in Camden County in 2024 (509 in 5+ unit buildings).
Forward outlook
- Local home prices are declining (-3.0%/yr); year-one equity from $864 of loan paydown is wiped out by about $4k of value loss. Plan a longer hold.
- Camden County population projected to shrink 8% by 2050 — rents likely to lag national; underwrite the cash flow, not the appreciation.
Negotiation context
- Only 4 days on market — expect competitive offers; lowballing is unlikely to land.
- Current owner paid $45k; list at $125k implies a 178% gain — meaningful room to come down on a strong offer.
Risks & watch-outs
- Watch-outs: property tax is 3.4% of price; built in 1954 — expect roof / HVAC / electrical / plumbing capex.
- Climate carrying-cost: major wind risk, 61% chance of damaging wind over 30y; extreme-heat days projected 7→15/yr by 2055 (HVAC capex compounding) — expect insurance premiums to compound above CPI over the hold.
Questions for the listing agent
- Built in 1954 — when were the roof, HVAC, electrical panel, plumbing, and water heater last replaced?
- Property tax is high relative to price — has the assessment been appealed recently, and will the sale trigger a re-assessment?
- Is there a deadline driving the sale (1031 exchange, divorce, estate, relocation)? That informs how much negotiation room exists.
- Schools are F-rated, which usually means shorter tenancies and higher turnover. Who's the typical renter profile here, and what's been the actual vacancy rate?
- Crime grade is D in this area — have there been break-ins, vandalism, or insurance claims at this property in the last 3 years? What carrier currently insures it and at what premium?
- What's the average days-on-market for RENTAL listings here right now (not sales)? A rising rental-DOM trend means longer vacancies and softer asking-rent achievability than the comps imply.
- What's the recent tenant-quality profile in this submarket — average credit score on applications, eviction rate, late-payment / NSF rate, and stable-employment percentage? A property-management company in the area should have these aggregated.
- How much new for-sale + rental construction is in the pipeline within 1–3 miles? Heavy new supply typically softens prices + rents 12–24 months out; constrained supply supports both.
Investment metrics
- 1% rule
- 1.29% ✓
- Cap rate
- 8.25%
- Cash-on-cash
- 6.99%
- DSCR
- 1.31
- GRM
- 6.5
CMA / ARV
- ARV (on-the-fly)
- $220,320
- Comps found
- 10
Show comp detail 10 sales within ~0.75 mi
| Address | Dist | Beds/Ba | Sqft | Sold | Price | $/sf | Match |
|---|---|---|---|---|---|---|---|
| 413 10th Ave | 0.22mi | 2/1.0 | 722 (+0%) | 4mo | $210,000 | $291 | 86 |
| 428 6th Ave | 0.23mi | 2/1.0 | 768 (+7%) | 0mo | $290,000 | $378 | 78 |
| 449 7th Ave | 0.27mi | 2/1.0 | 720 (0%) | 11mo | $252,500 | $351 | 78 |
| 424 10th Ave | 0.26mi | 2/1.0 | 720 (0%) | 24mo | $145,000 | $201 | 68 |
| 335 10th Ave | 0.15mi | 1/1.0 (-1) | 735 (+2%) | 21mo | $225,000 | $306 | 67 |
| 340 9th Ave | 0.14mi | 2/1.0 | 800 (+11%) | 14mo | $250,000 | $313 | 64 |
| 112 State Ave | 0.69mi | 2/1.0 | 700 (-3%) | 15mo | $235,000 | $336 | 51 |
| 457 4th Ave | 0.33mi | 2/1.0 | 827 (+15%) | 14mo | $221,100 | $267 | 48 |
| 802 Blackwood Clementon Rd | 0.45mi | 3/1.0 (+1) | 760 (+6%) | 22mo | $220,000 | $289 | 46 |
| 14 Wilson Rd | 0.54mi | 3/1.0 (+1) | 816 (+13%) | 9mo | $241,000 | $295 | 40 |
Match score weights: distance 35% · size 25% · config 20% · recency 20%. Top-matched comps best support the ARV.
Projected returns pro-forma
-3.0% appreciation · 3.02% rent growth · sell at horizon
- IRR
- -5.4%
- Equity multiple
- 0.80×
- Total profit
- $-7,091
- Equity at exit
- $18,638
- IRR
- 4.4%
- Equity multiple
- 1.32×
- Total profit
- $11,280
- Equity at exit
- $10,808
Cash invested: $35,000 (down + closing). Projections, not guarantees.
Landlord ↔ Tenant lean methodology
- Overall (STATE)
- 21 Tenant-Leaning
- State New Jersey
- 21 Tenant-Leaning · D+6
- County
- — inherits STATE
- City
- — inherits STATE
ZIP-level market 08021
- Home prices YoY
- -31.6%
- Rents YoY
- 3.0%
- Active inventory
- 242
- Price-to-rent
- 6.5×
Monthly cashflow live
- Estimated rent
- $1,607 high interval (Pro) →
- Mortgage (P&I)
- −$656
- Tax from tax record
- −$358 /mo · $4,300/yr
- Insurance
- −$52
- HOA
- −$0
- Vacancy / Maint / Mgmt
- −$338
- Net cashflow
- $204
Break-even live
Sensitivity live
| Price | -10% $275 | -5% $239 | +0% $204 | +5% $168 | +10% $133 |
|---|---|---|---|---|---|
| Rent | -10% $77 | -5% $140 | +0% $204 | +5% $267 | +10% $331 |
| Rate | -1.0pp $267 | -0.5pp $236 | base $204 | +0.5pp $171 | +1.0pp $139 |
UW: 25.0% down · 7.5% · 30yr · 1.5% tax · 5.0% vac · 8.0% maint · 8.0% mgmt
Financing live
Cash to close
- Down payment
- $31,250
- Closing costs
- $3,750
- Reserves months
- —
- Total cash needed
- —
Loan-product check · same deal, 3 products live
Conventional
25% down · 7.5% · 30yr
- Down + closing
- —
- Monthly P&I
- —
- Monthly cashflow
- —
- DSCR
- —
- Eligible?
- —
Personal DTI + credit; lowest rate.
DSCR
20% down · 8.5% · 30yr
- Down + closing
- —
- Monthly P&I
- —
- Monthly cashflow
- —
- DSCR
- —
- Eligible?
- —
No personal income docs; deal must DSCR.
Hard money
10% down · 12.0% · 12mo
- Down + closing
- —
- Monthly P&I
- —
- Monthly cashflow
- —
- DSCR
- —
- Eligible?
- —
Short-term bridge; refi at stabilization.
Rent comps 13 comps
| Address | Beds | Baths | Sqft | Rent | $/sqft | DOM | Units | Dist |
|---|---|---|---|---|---|---|---|---|
| 105 Blackwood Clementon Rd Lindenwold, NJ | 1.0–2.0 | 1.0 | 800 | $1,600 | $2.00 | 18d | 1 | 0.39mi |
| 500 Chews Landing Rd Lindenwold, NJ | 1.0–2.0 | 1.0 | 875 | $1,750 | $2.00 | 26d | 1 | 0.44mi |
| 828 Blackwood Clementon Rd Pine Hill, NJ | 1.0–2.0 | 1.0 | 734 | $1,575 | $2.15 | 23d | 1 | 0.48mi |
| 116 Blackwood Clementon Rd Clementon, NJ | 1.0 | 1.0 | 610 | $1,225 | $2.01 | 7d | 3 | 0.60mi |
| 4 Lincoln Ave Clementon, NJ | 1.0–2.0 | 1.0 | 725 | $1,550 | $2.14 | 7d | 2 | 0.74mi |
| 1800 Laurel Rd Lindenwold, NJ | 1.0–2.0 | 1.0–2.0 | 885 | $2,072 | $2.34 | 0d | 25 | 0.77mi |
| 1900 Laurel Rd Lindenwold, NJ | 1.0–2.0 | 1.0 | 625 | $1,650 | $2.64 | 26d | 1 | 0.83mi |
| 125 S White Horse Pike Clementon, NJ | 1.0 | 1.0 | 630 | $1,365 | $2.17 | 6d | 2 | 0.89mi |
| 1000 W Atlantic Ave Laurel Springs, NJ | 1.0 | 1.0 | 770 | $1,350 | $1.75 | 0d | 2 | 0.89mi |
| 1990 Laurel Rd Apt AK313 Lindenwold, NJ | 1.0–2.0 | 1.0 | 691 | $1,450 | $2.10 | 14d | 3 | 0.94mi |
| 225 La Cascata Clementon, NJ | 1.0 | 1.0 | 616 | $1,575 | $2.56 | 3d | 1 | 0.97mi |
| 617 N White Horse Pike Laurel Springs, NJ | 1.0 | 1.0 | 600 | $1,220 | $2.03 | 22d | 1 | 1.10mi |
| 91 Oak St Unit 1BR Clementon, NJ | 1.0 | 1.0 | 650 | $1,499 | $2.31 | 6d | 1 | 1.15mi |
Listing history 5 events
-
2026-06-10status $125,000 Pending 4 DOM
-
2026-06-09days on market $125,000 Active 4 DOM
-
2026-06-08days on market $125,000 Active 3 DOM
-
2026-06-07remarks 573-char remark
-
2026-06-07$125,000 Active 2 DOM
ⓘ Source: listings_history table (triggers on properties + properties_extension) + one-shot
backfill from property_details.listing_events for pre-trigger history.
Tax reassessment forecast NJ · Partial reset (capped growth)
- Current annual tax
- $4,300 · $358/mo
- Projected year-2 tax
- $4,300 · $358/mo
- Expected delta
- $0/yr ($0/mo · 0.0%)
ⓘ Screening estimate from a state-policy table — verify with the county assessor before closing.
Climate risk First Street
- Flood 1/10 Low FEMA zone X (unshaded) · 0% chance over 30 yrs
- Wildfire 2/10 Low
- Heat 7/10 Severe 7 d/yr ≥103°F today · 15 d/yr by 30 yrs out
- Wind 6/10 Major 61% chance of damaging wind over 30 yrs
- Air quality 3/10 Moderate 3 unhealthy d/yr today · 3 by 30 yrs out
Nearby sold comps map
Loading sold comps map…
Walkable amenities ~0.75 mi
Loading nearby amenities…
Taxation est. · year 1
- Rental income
- $19,288
- − Mortgage interest
- −$7,002
- − Property taxes
- −$4,300
- − Insurance
- −$625
- − Repairs & maintenance
- −$1,543
- − Management
- −$1,543
- − Depreciation
- −$3,636
- Taxable income
- $639
- Est. tax owed @ 24.0%
- −$153
- After-tax cash flow
- $2,293/yr
For passive investors: Depreciation is non-cash, so a rental often shows a tax loss while cash-flowing — sheltering income. Rental losses are passive: they offset passive income freely, and up to $25,000/yr can offset ordinary (W-2) income if you actively participate and your MAGI is under $100k (phasing out to $0 by $150k); unused losses carry forward. On sale, claimed depreciation is recaptured at up to 25%, and gains may owe capital-gains tax (a 1031 exchange can defer both). Figures are a year-1 estimate at your 24.0% rate — not tax advice; consult a CPA.
Schools (NCES district)
- District
- Lindenwold Public School District
- NCES district ID
- 3408640
- Math proficiency
- 4% ▼ -8.00%
- Reading proficiency
- 25% ▲ 6.00%
- Median HH income
- $42,390
- Composite
- 12.54/100
- National rank
- #9622
- State rank
- #461 of 472 in NJ
Livability — Lindenwold
- Score
- 68/100
- State rank
- #312
- US rank
- #9603
Category grades
Schools grade is shown separately in the Schools card above.
Census & demographics
- Census place
- Lindenwold, NJ
- County
- Camden County · 407,624 people
- City population
- 49,305
- Metro
- Philadelphia-Camden-Wilmington, PA-NJ-DE-MD
- Population (ZIP)
- 49,305
- Household income
- $68,044
- Rent vs Own
- Severe rent burden
- 3050.0
Population outlook (Camden County) Hauer SSP2
- Today (2025)
- 507,964 people
- By 2030
- 502,182 · -1.1%
- By 2040
- 485,602 · -4.4%
- By 2050
- 465,630 · -8.3%
- By 2075
- 419,986 · -17.3%
- By 2100
- 369,492 · -27.3%
Race, ethnicity, and origin ACS 2023
- Neighborhood character
- Diverse neighborhood (Simpson 0.69)
- Race & ethnicity
- White 44% Black 27% Hispanic / Latino 20% Two or more races 11% Asian 3%
- Hispanic origin (detail)
- Mexican 4% Puerto Rican 6% Dominican 2%
- Common ancestry
- Romanian 3% Lithuanian 1% Iranian 1%
- Foreign-born
- 12% · Canada, China, Vietnam
- Languages at home
- 81% English-only · Spanish 14% Chinese 1% Tagalog/Filipino 1%
Political lean MEDSL · Camden
- 2024 margin
- Strong D (+27.4) · D 63.0% · R 35.5% · Other 1.5%
- 2008→2024 swing
- -8.8pp toward R · 2008: 36.2pp · 2024: 27.4pp
- All cycles
- 2024: D+27.4 2020: D+33.5 2016: D+32.4 2012: D+36.6 2008: D+36.2
Not yet ingested
- Civics
- —
Market trends
- HPI YoY
- ▼ -156.73%
- Current HPI
- 338.8351
- Rent YoY
- ▲ 3.02%
- Metro
- Philadelphia-Camden-Wilmington, PA-NJ-DE-MD
- State GDP YoY
- ▲ 2.05%
- F500 in state
- 34
Industry mix (Fortune 500 HQ in NJ)
| Industry | F500 HQs | Revenue |
|---|---|---|
| Consumer Goods | 3 | $31B |
|
||
| Pharmaceuticals | 2 | $153B |
|
||
| Technology | 2 | $21B |
|
||
| Insurance | 2 | $20B |
|
||
| Healthcare | 2 | $19B |
|
||
| Financial Services | 1 | $70B |
|
||
Price history
+331.0% since first listed3 events — show timeline
- 2026-06-05 Listed $125,000 BRIGHT MLS
- 1985-10-31 Sold (Public Records) $45,000 Public Records
- 1978-11-01 Sold (Public Records) $29,000 Public Records
Property tax history
+1.0%/yrLatest (2025): $4,300 · +0.5% YoY. Source: county tax records.
Cash-flow waterfall
monthlySold comps — $/sqft
last 12 mo · ≤1 miLoading sold comps…