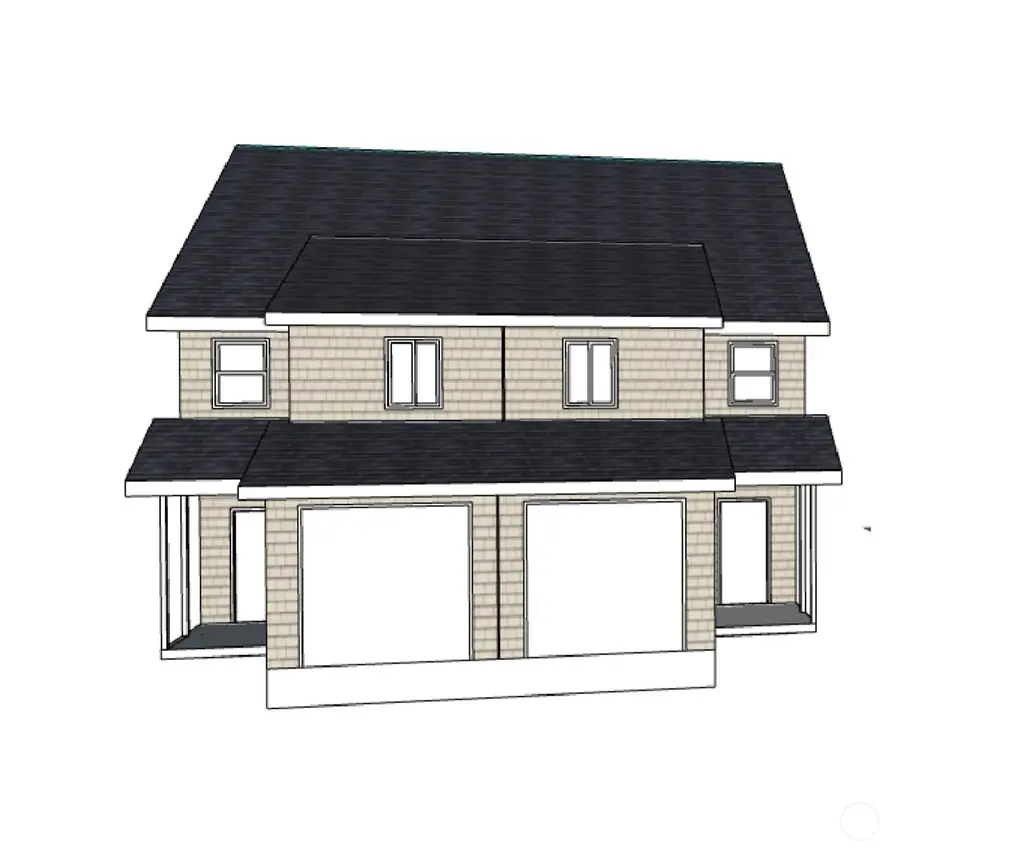
1610 Decatur St SW
Olympia, WA 98502
$819,000D
6 bd · 6.0 ba ·
2,964 sqft ·
Built 2026
· MultiFamily
· Active
· 6 DOM
Cashflow @ list (25.0% down · 7.5%)
Estimated rent
$4,290/mo
Mortgage (P&I)
−$3,295
Tax + insurance
−$1,047
HOA
−$0
Vac / Maint / Mgmt
−$901
Net cashflow
$-953/mo
Annual
$-11,441/yr
Cap rate
4.47%
Cash-on-cash
-6.50%
DSCR
0.71
1% rule
0.68%
Cash to close
$175,943
Investor read
- This is a 2 × 3-bed/3.0-bath units multifamily listed at $819k.
- At list price, monthly cash flow is $-953 ($-11k/yr) — negative. Per door: $-477/mo.
- To cash-flow at today's rent, offer at most $490k (40.1% below list).
- To meet the 1% rule (rent ≥ 1% of price), the offer needs to be $429k (47.6% below list).
- Only 6 days on market — expect competitive offers; lowballing is unlikely to land.
- Recommended offer: $429k (47.6% below list) — sets the bar for 1% rule.
- In year one you build about $67k of equity ($4k loan paydown + $63k appreciation (10.0% local appreciation)).
- Location reads 83/100 on livability (#58 in WA, #1,036 nationally) — a professional / high-income tenant draw. Strengths: amenities A+, commute A+, health & safety A+; Watch: crime F, cost of living D-.
- Olympia School District (urban): math 66% / reading 75% proficiency, ranked #17 of 291 in WA (top 6%) — strong family-tenant draw, lease renewals of 3-5y typical.
- Zoned schools: Julia Butler Hansen Elementary (484 students, 48% FRL); Capital High School (1,326 students, 38% FRL) — zoned schools average 43% FRL vs 25% district-wide (18 pts higher); higher-poverty schools than district average — tighter screening recommended.
- Market conditions: Rents rising (+3.2%/yr); 304 active listings in the ZIP; solid renter incomes; 1,222 units permitted in Thurston County in 2024 (508 in 5+ unit buildings).
- Thurston County population projected at +27% by 2050 — long-run rental-demand tailwind backs the buy-and-hold thesis.
- By year 2, paydown + projected appreciation supports a ~$108k cash-out refi (75% LTV) — recoverable capital for the next deal without selling this one.
- Cap rate 4.5% vs local median 2.4% in Olympia — top-decile yield for the area; either an underpriced asset or a hidden risk that comps aren't pricing in. Stress-test before assuming the spread holds.
- At $4,290/mo this rent would consume 56% of the median local household income ($92k/yr) (locally 1811% of renters already pay >50% of income on rent) — very limited rent-growth headroom before tenants either downsize or default.
Questions for listing agent
- What do current leases actually rent for vs. the listed asking? Can we see a recent rent roll and the last 12 months of T-12 income?
- Can we see the unit-by-unit rent roll, current vacancy, and any below-market leases? What's the average tenancy length?
- What capital expenditures (roof, boiler, parking lot, exteriors) have been made in the last 5 years, and what's planned in the next 2?
- Is there a deadline driving the sale (1031 exchange, divorce, estate, relocation)? That informs how much negotiation room exists.
- Schools are A-rated — typically a magnet for longer-tenancy family renters. What's the average tenant stay here, and is there a school-zone premium baked into asking?
- Crime grade is F in this area — have there been break-ins, vandalism, or insurance claims at this property in the last 3 years? What carrier currently insures it and at what premium?
- The area grade is low — what's the realistic commute time and amenity access for the typical tenant pool here? Any planned neighborhood developments (good or bad) we should know about?
- What's the average days-on-market for RENTAL listings here right now (not sales)? A rising rental-DOM trend means longer vacancies and softer asking-rent achievability than the comps imply.
CashFlowRE · CFR-Q5ENFZ486GDRJK
· Data 2 days ago
cashflowre.app · 2026-05-29