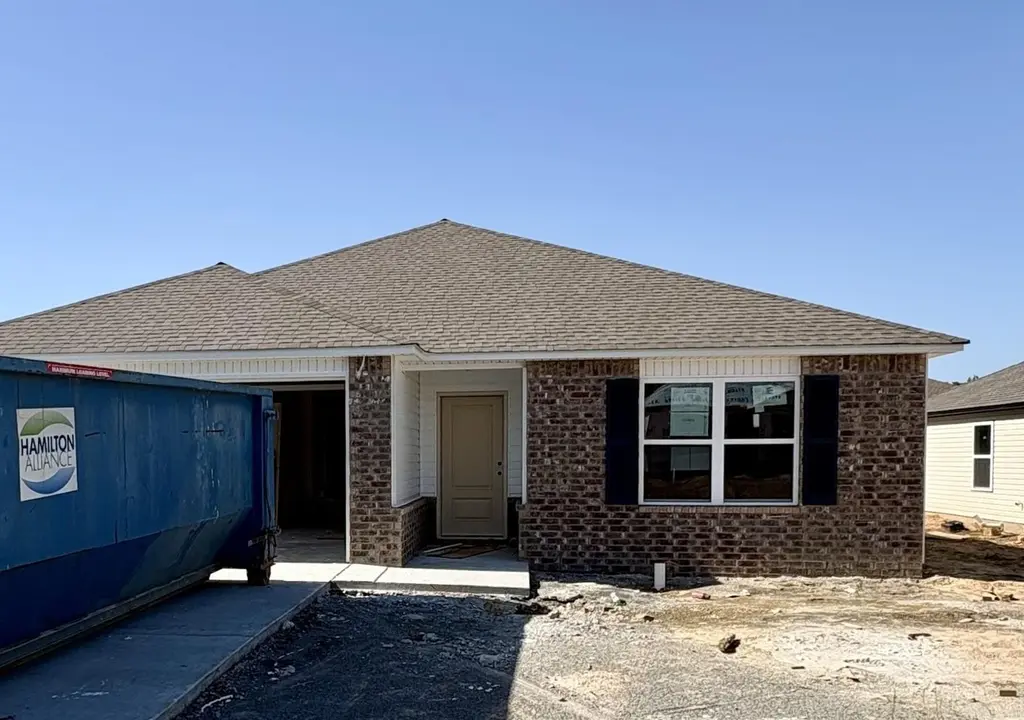
7 E Reliance Ct
Mayflower, AR 72106
$209,900D-
3 bd · 2.0 ba ·
1,355 sqft ·
Built 2026
· SingleFamily
· Under Contract
· 40 DOM
Cashflow @ list (25.0% down · 7.5%)
Estimated rent
$1,754/mo
Mortgage (P&I)
−$1,101
Tax + insurance
−$350
HOA
−$227
Vac / Maint / Mgmt
−$368
Net cashflow
$-292/mo
Annual
$-3,502/yr
Cap rate
4.62%
Cash-on-cash
-5.96%
DSCR
0.73
1% rule
0.84%
Cash to close
$58,772
Investor read
- This is a 3-bed/2.0-bath single-family listed at $210k. Condition is rated excellent.
- At list price, monthly cash flow is $-292 ($-4k/yr) — negative.
- To cash-flow at today's rent, offer at most $168k (20.1% below list).
- To meet the 1% rule (rent ≥ 1% of price), the offer needs to be $175k (16.4% below list).
- It's been on market 40 days — a 3% lower offer ($204k) is reasonable based on typical stale-listing flexibility.
- Recommended offer: $168k (20.1% below list) — sets the bar for cash-flow.
- In year one you build about $22k of equity ($1k loan paydown + $20k appreciation (9.6% local appreciation)).
- Location reads 56/100 on livability (#390 in AR) — a working-class tenant base; expect higher turnover. Strengths: cost of living A+, housing B+; Watch: crime F, amenities F, commute F.
- Mayflower School District (rural): math 32% / reading 34% proficiency, ranked #127 of 238 in AR (top 53%) — families likely to look elsewhere, expect single-tenant / working-renter base with shorter leases.
- Zoned schools: Mayflower Elementary School (math 52% / reading 32%, grade F, #173 of 454 statewide, top 43%, 373 students, 70% FRL); Mayflower Middle School (math 31% / reading 37%, grade F, #127 of 201 statewide, top 64%, 315 students, 68% FRL); Mayflower High School (math 22% / reading 32%, grade F, #164 of 292 statewide, top 61%, 357 students, 57% FRL) — zoned schools average 65% FRL vs 47% district-wide (18 pts higher); higher-poverty schools than district average — tighter screening recommended.
- Market conditions: 114 active listings in the ZIP; 8 comparable units currently listed for rent nearby; rentals lingering (median 46d on market — plan ~5-8 weeks vacancy on turnover, expect pricing pressure); 50% of comp listings sitting > 30 days — soft ceiling on asking rent; 865 units permitted in Faulkner County in 2024 (451 in 5+ unit buildings).
- Faulkner County population projected at +32% by 2050 — long-run rental-demand tailwind backs the buy-and-hold thesis.
- By year 2, paydown + projected appreciation supports a ~$35k cash-out refi (75% LTV) — recoverable capital for the next deal without selling this one.
- Climate carrying-cost: extreme-heat days projected 7→20/yr by 2055 (HVAC capex compounding) — expect insurance premiums to compound above CPI over the hold.
Questions for listing agent
- What do current leases actually rent for vs. the listed asking? Can we see a recent rent roll and the last 12 months of T-12 income?
- It's been on market 40 days. Have you received any prior offers? Is the seller open to a 20% concession, seller financing, or rate buy-down credit?
- What does the HOA fee cover, when was the last increase, and are there any pending special assessments or reserve-fund shortfalls?
- Is there a deadline driving the sale (1031 exchange, divorce, estate, relocation)? That informs how much negotiation room exists.
- Schools are F-rated, which usually means shorter tenancies and higher turnover. Who's the typical renter profile here, and what's been the actual vacancy rate?
- Crime grade is F in this area — have there been break-ins, vandalism, or insurance claims at this property in the last 3 years? What carrier currently insures it and at what premium?
- The area grade is low — what's the realistic commute time and amenity access for the typical tenant pool here? Any planned neighborhood developments (good or bad) we should know about?
- What's the average days-on-market for RENTAL listings here right now (not sales)? A rising rental-DOM trend means longer vacancies and softer asking-rent achievability than the comps imply.
CashFlowRE · CFR-Q6K1H19166CCXM
· Data 5 days ago
cashflowre.app · 2026-05-29