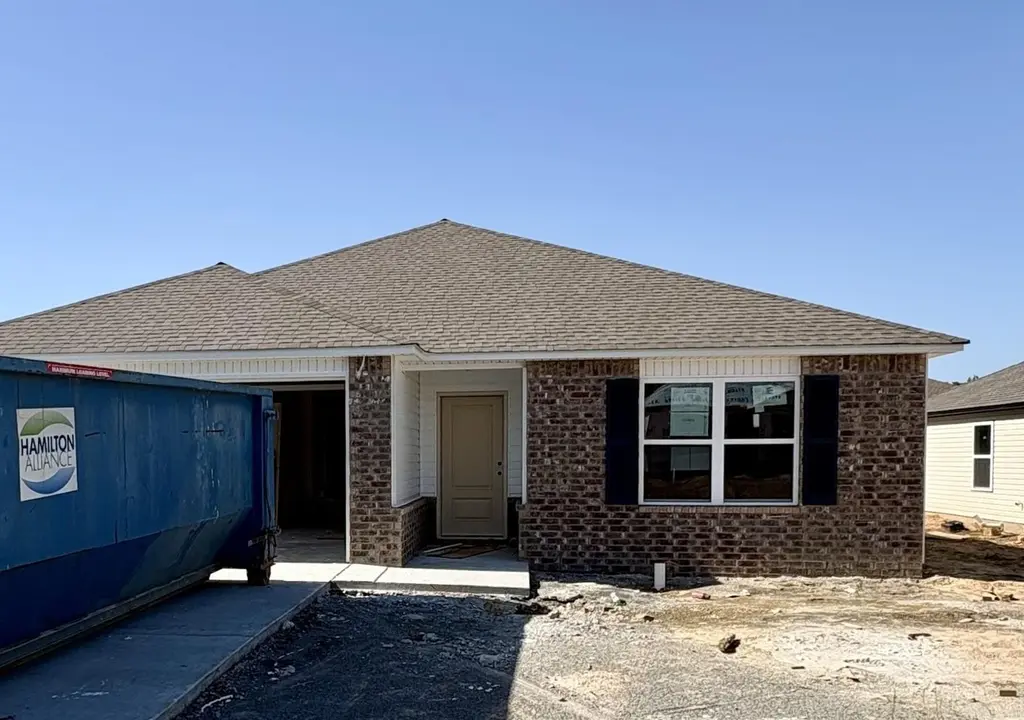
7 E Reliance Ct · Mayflower, AR
Flood risk 1/10 · Minimal
- FEMA flood zone
- X (unshaded)
- Chance of flooding over 30 yrs
- 0.0%
- Est. flood insurance / yr
- $507 – $1,088
Fire risk 3/10 · Minor
- Est. fire insurance / yr
- $1,499 – $2,785
Heat risk 7/10 · Major
- Hot days now (above 111°F)
- 7 days/yr
- Hot days in 30 yrs
- 20 days/yr
Wind risk 3/10 · Minor
- Chance of severe wind over 30 yrs
- 7.0%
Air-quality risk 2/10 · Minimal
- Unhealthy air days now
- 0 days/yr
- Unhealthy air days in 30 yrs
- 1 days/yr
Risk factors via First Street. Map © Google.
Why this score? — see what drove the D- grade
The composite is a weighted blend of 9 inputs, each scored 0–100. Each bar is that input's sub-score; the figure is the points it added to the 100-point composite (weight × sub-score).
- Appreciation +9.8/10.0
- Cash flow +7.2/30.0
- Condition / age +5.0/5.0
- ARV discount +4.4/15.0
- 1% rule +3.4/10.0
- Schools +2.8/10.0
- Livability +2.8/5.0
- Rent growth +2.5/5.0
- DSCR +1.3/10.0
$209,900
🖨 Deal sheet (PDF) 📄 Offer letter ✓ Due diligence
Listing remarks
The Foster II plan is a charming and inviting home design that exudes curb appeal with its front porch and well-maintained front yard landscaping, creating an inviting atmosphere right from the curb. This open-concept home provides a spacious living experience with 3 bedrooms and 2 bathrooms, ensuring ample room for comfort and privacy. The kitchen is a standout feature of the home, boasting a complete set of energy-efficient appliances that cater to modern needs and preferences. Whether you're cooking daily meals or hosting gatherings, the Foster II plan offers functionality and style. Explore more about this delightful home today to see how it can meet your lifestyle preferences and needs
Key facts
- Open-concept home
- Front porch
- Detached
Tags
Property features AI
Finance
- Other: Listing status: Active
- Financial info: List price $211,900
Exterior
- Parking: 2 total parking spaces; 2-car garage
- Home design: Spec new construction — Plan: Rc Foster II
- Exterior features: Located at 7 E Reliance Ct, Mayflower, AR 72106
Interior
- Bedrooms: 3 bedrooms
- Bathrooms: 2 full bathrooms
- Interior features: Living area of 1,355
Neighborhood map
What this means for you Summary
Snapshot
- This is a 3-bed/2.0-bath single-family listed at $210k. Condition is rated excellent.
Deal economics
- At list price, monthly cash flow is $-292 ($-4k/yr) — negative.
- To cash-flow at today's rent, offer at most $168k (20.1% below list).
- To meet the 1% rule (rent ≥ 1% of price), the offer needs to be $175k (16.4% below list).
- Recommended offer: $168k (20.1% below list) — sets the bar for cash-flow.
Location & tenants
- Location reads 56/100 on livability (#390 in AR) — a working-class tenant base; expect higher turnover. Strengths: cost of living A+, housing B+; Watch: crime F, amenities F, commute F.
- Mayflower School District (rural): math 32% / reading 34% proficiency, ranked #127 of 238 in AR (top 53%) — families likely to look elsewhere, expect single-tenant / working-renter base with shorter leases.
- Zoned schools: Mayflower Elementary School (math 52% / reading 32%, grade F, #173 of 454 statewide, top 43%, 373 students, 70% FRL); Mayflower Middle School (math 31% / reading 37%, grade F, #127 of 201 statewide, top 64%, 315 students, 68% FRL); Mayflower High School (math 22% / reading 32%, grade F, #164 of 292 statewide, top 61%, 357 students, 57% FRL) — zoned schools average 65% FRL vs 47% district-wide (18 pts higher); higher-poverty schools than district average — tighter screening recommended.
- Market conditions: 114 active listings in the ZIP; 8 comparable units currently listed for rent nearby; rentals lingering (median 46d on market — plan ~5-8 weeks vacancy on turnover, expect pricing pressure); 50% of comp listings sitting > 30 days — soft ceiling on asking rent; 865 units permitted in Faulkner County in 2024 (451 in 5+ unit buildings).
Forward outlook
- In year one you build about $22k of equity ($1k loan paydown + $20k appreciation (9.6% local appreciation)).
- Faulkner County population projected at +32% by 2050 — long-run rental-demand tailwind backs the buy-and-hold thesis.
- By year 2, paydown + projected appreciation supports a ~$35k cash-out refi (75% LTV) — recoverable capital for the next deal without selling this one.
Negotiation context
- It's been on market 40 days — a 3% lower offer ($204k) is reasonable based on typical stale-listing flexibility.
Risks & watch-outs
- Climate carrying-cost: extreme-heat days projected 7→20/yr by 2055 (HVAC capex compounding) — expect insurance premiums to compound above CPI over the hold.
Questions for the listing agent
- What do current leases actually rent for vs. the listed asking? Can we see a recent rent roll and the last 12 months of T-12 income?
- It's been on market 40 days. Have you received any prior offers? Is the seller open to a 20% concession, seller financing, or rate buy-down credit?
- What does the HOA fee cover, when was the last increase, and are there any pending special assessments or reserve-fund shortfalls?
- Is there a deadline driving the sale (1031 exchange, divorce, estate, relocation)? That informs how much negotiation room exists.
- Schools are F-rated, which usually means shorter tenancies and higher turnover. Who's the typical renter profile here, and what's been the actual vacancy rate?
- Crime grade is F in this area — have there been break-ins, vandalism, or insurance claims at this property in the last 3 years? What carrier currently insures it and at what premium?
- The area grade is low — what's the realistic commute time and amenity access for the typical tenant pool here? Any planned neighborhood developments (good or bad) we should know about?
- What's the average days-on-market for RENTAL listings here right now (not sales)? A rising rental-DOM trend means longer vacancies and softer asking-rent achievability than the comps imply.
- What's the recent tenant-quality profile in this submarket — average credit score on applications, eviction rate, late-payment / NSF rate, and stable-employment percentage? A property-management company in the area should have these aggregated.
- How much new for-sale + rental construction is in the pipeline within 1–3 miles? Heavy new supply typically softens prices + rents 12–24 months out; constrained supply supports both.
Investment metrics
- 1% rule
- 0.84% ✗
- Cap rate
- 4.62%
- Cash-on-cash
- -5.96%
- DSCR
- 0.73
- GRM
- 10.0
CMA / ARV
- ARV (on-the-fly)
- $196,475
- Comps found
- 12
Show comp detail 12 sales within ~0.75 mi
| Address | Dist | Beds/Ba | Sqft | Sold | Price | $/sf | Match |
|---|---|---|---|---|---|---|---|
| 17 E Reliance Ct | 0.11mi | 3/2.0 | 1,355 (0%) | 1mo | $212,400 | $157 | 94 |
| 11 Vineyard Dr | 0.15mi | 3/2.0 | 1,364 (+1%) | 3mo | $191,000 | $140 | 90 |
| 5 Vineyard Dr | 0.17mi | 3/2.0 | 1,364 (+1%) | 3mo | $191,000 | $140 | 89 |
| 13 E Reliance Ct | 0.08mi | 3/2.0 | 1,472 (+9%) | 0mo | $219,900 | $149 | 82 |
| 16 E Reliance Ct | 0.11mi | 3/2.0 | 1,472 (+9%) | 0mo | $222,900 | $151 | 80 |
| 14 Cross St | 0.27mi | 4/1.0 (+1) | 1,352 (-0%) | 1mo | $159,000 | $118 | 77 |
| 18 Wheeler St | 0.48mi | 3/2.0 | 1,354 (-0%) | 2mo | $205,000 | $151 | 75 |
| 121 E Fredonia Ct | 0.16mi | 3/2.0 | 1,473 (+9%) | 5mo | $241,000 | $164 | 74 |
| 15 E Reliance Ct | 0.10mi | 3/2.0 | 1,523 (+12%) | 1mo | $220,900 | $145 | 74 |
| 13 Vineyard Dr | 0.14mi | 4/2.0 (+1) | 1,476 (+9%) | 2mo | $196,000 | $133 | 72 |
| 7 Vineyard Dr | 0.16mi | 4/2.0 (+1) | 1,476 (+9%) | 3mo | $196,000 | $133 | 70 |
| 9 Center | 0.38mi | 4/1.0 (+1) | 1,224 (-10%) | 2mo | $95,000 | $78 | 55 |
Match score weights: distance 35% · size 25% · config 20% · recency 20%. Top-matched comps best support the ARV.
Projected returns pro-forma
9.62% appreciation · 3.0% rent growth · sell at horizon
- IRR
- 19.2%
- Equity multiple
- 2.54×
- Total profit
- $90,421
- Equity at exit
- $183,270
- IRR
- 17.8%
- Equity multiple
- 5.76×
- Total profit
- $279,861
- Equity at exit
- $389,190
Cash invested: $58,772 (down + closing). Projections, not guarantees.
Landlord ↔ Tenant lean methodology
- Overall (STATE)
- 92 Strongly Landlord-Friendly
- State Arkansas
- 92 Strongly Landlord-Friendly · R+14
- County
- — inherits STATE
- City
- — inherits STATE
ZIP-level market 72106
- Home prices YoY
- 4.2%
- Active inventory
- 114
- Price-to-rent
- 10.0×
Monthly cashflow live
- Estimated rent
- $1,754 high interval (Pro) →
- Mortgage (P&I)
- −$1,101
- Tax est. 1.5%
- −$262 /mo · $3,148/yr
- Insurance
- −$87
- HOA
- −$227
- Vacancy / Maint / Mgmt
- −$368
- Net cashflow
- $-292
Break-even live
Sensitivity live
| Price | -10% $-147 | -5% $-219 | +0% $-292 | +5% $-364 | +10% $-437 |
|---|---|---|---|---|---|
| Rent | -10% $-430 | -5% $-361 | +0% $-292 | +5% $-223 | +10% $-153 |
| Rate | -1.0pp $-186 | -0.5pp $-238 | base $-292 | +0.5pp $-346 | +1.0pp $-402 |
UW: 25.0% down · 7.5% · 30yr · 1.5% tax · 5.0% vac · 8.0% maint · 8.0% mgmt
Financing live
Cash to close
- Down payment
- $52,475
- Closing costs
- $6,297
- Reserves months
- —
- Total cash needed
- —
Loan-product check · same deal, 3 products live
Conventional
25% down · 7.5% · 30yr
- Down + closing
- —
- Monthly P&I
- —
- Monthly cashflow
- —
- DSCR
- —
- Eligible?
- —
Personal DTI + credit; lowest rate.
DSCR
20% down · 8.5% · 30yr
- Down + closing
- —
- Monthly P&I
- —
- Monthly cashflow
- —
- DSCR
- —
- Eligible?
- —
No personal income docs; deal must DSCR.
Hard money
10% down · 12.0% · 12mo
- Down + closing
- —
- Monthly P&I
- —
- Monthly cashflow
- —
- DSCR
- —
- Eligible?
- —
Short-term bridge; refi at stabilization.
Rent comps 8 comps
| Address | Beds | Baths | Sqft | Rent | $/sqft | DOM | Units | Dist |
|---|---|---|---|---|---|---|---|---|
| 104 E Fredonia Ct Mayflower, AR | 4.0 | 2.0 | 1476 | $1,750 | $1.19 | 45d | 1 | 0.10mi |
| 17 Vineyard Dr Mayflower, AR | 4.0 | 2.0 | 1655 | $1,850 | $1.12 | 16d | 1 | 0.10mi |
| 101 E Fredonia Ct Mayflower, AR | 4.0 | 2.0 | 1655 | $1,923 | $1.16 | 16d | 1 | 0.13mi |
| 103 E Fredonia Ct Mayflower, AR | 3.0 | 2.0 | 1364 | $1,650 | $1.21 | 16d | 1 | 0.13mi |
| 11 Vineyard Dr Mayflower, AR | 3.0 | 2.0 | 1364 | $1,650 | $1.21 | 45d | 1 | 0.13mi |
| 7 Vineyard Dr Mayflower, AR | 4.0 | 2.0 | 1476 | $1,750 | $1.19 | 45d | 1 | 0.15mi |
| 5 Vineyard Dr Mayflower, AR | 3.0 | 2.0 | 1364 | $1,650 | $1.21 | 45d | 1 | 0.16mi |
| 3 Vineyard Dr Mayflower, AR | 4.0 | 2.0 | 1655 | $1,850 | $1.12 | 16d | 1 | 0.17mi |
HOA detail
- Monthly dues
- $227 · $2,724/yr
- Likely covers
- landscaping
Listing history 11 events
-
2026-06-16statusdays on market $209,900 Under Contract 40 DOM
-
2026-06-15statusdays on market $209,900 Active 39 DOM
-
2026-06-14days on market $209,900 Price Change 37 DOM
-
2026-06-10days on market $209,900 Price Change 34 DOM
-
2026-06-09days on market $209,900 Price Change 33 DOM
-
2026-06-09pricestatus $209,900 Price Change 32 DOM
-
2026-06-08days on market $211,900 Active 32 DOM
-
2026-06-07remarks 699-char remark
-
2026-06-07days on market $211,900 Active 31 DOM
-
2026-06-05remarks 433-char remark
-
2026-06-05$211,900 Active 43 DOM
ⓘ Source: listings_history table (triggers on properties + properties_extension) + one-shot
backfill from property_details.listing_events for pre-trigger history.
Climate risk First Street
- Flood 1/10 Low FEMA zone X (unshaded) · 0% chance over 30 yrs
- Wildfire 3/10 Moderate
- Heat 7/10 Severe 7 d/yr ≥111°F today · 20 d/yr by 30 yrs out
- Wind 3/10 Moderate 7% chance of damaging wind over 30 yrs
- Air quality 2/10 Low 0 unhealthy d/yr today · 1 by 30 yrs out
Nearby sold comps map
Loading sold comps map…
Walkable amenities ~0.75 mi
Loading nearby amenities…
Taxation est. · year 1
- Rental income
- $21,049
- − Mortgage interest
- −$11,758
- − Property taxes
- −$3,148
- − Insurance
- −$1,050
- − Repairs & maintenance
- −$1,684
- − Management
- −$1,684
- − HOA
- −$2,724
- − Depreciation
- −$6,106
- Taxable loss
- −$7,105
- Est. tax savings @ 24.0%
- +$1,705
- After-tax cash flow
- $-1,797/yr
For passive investors: Depreciation is non-cash, so a rental often shows a tax loss while cash-flowing — sheltering income. Rental losses are passive: they offset passive income freely, and up to $25,000/yr can offset ordinary (W-2) income if you actively participate and your MAGI is under $100k (phasing out to $0 by $150k); unused losses carry forward. On sale, claimed depreciation is recaptured at up to 25%, and gains may owe capital-gains tax (a 1031 exchange can defer both). Figures are a year-1 estimate at your 24.0% rate — not tax advice; consult a CPA.
Condition & rehab AI · 6 photos
This new single-story home is in excellent condition with no visible repairs or maintenance needed. It is move-in ready and has the potential to be further enhanced with fresh paint and landscaping.
Value-add opportunities
- Both Painting the exterior and interior — Fresh paint can enhance curb appeal and interior aesthetics.
- Both Landscaping the front yard — Well-maintained landscaping can improve curb appeal and add value to the property.
Renovation cost estimate screening
Value-add ROI direction
- Both Painting the exterior and interior — Fresh paint can enhance curb appeal and interior aesthetics. ↑
- Both Landscaping the front yard — Well-maintained landscaping can improve curb appeal and add value to the property. ↑
ⓘ Cost ranges are severity-bucket heuristics (US national rule-of-thumb). Get contractor quotes + a written scope before underwriting a rehab budget.
Schools (NCES district)
- District
- Mayflower School District
- NCES district ID
- 0509540
- Math proficiency
- 32% ▼ -9.00%
- Reading proficiency
- 34% ▼ -6.00%
- Median HH income
- $47,119
- Composite
- 28.41/100
- National rank
- #6760
- State rank
- #127 of 238 in AR
Livability — Mayflower
- Score
- 56/100
- State rank
- #390
- US rank
- #22893
Category grades
Schools grade is shown separately in the Schools card above.
Census & demographics
- Census place
- Mayflower, AR
- Population (ZIP)
- 5,719
Population outlook (Faulkner County) Hauer SSP2
- Today (2025)
- 138,985 people
- By 2030
- 148,264 · +6.7%
- By 2040
- 166,010 · +19.4%
- By 2050
- 183,362 · +31.9%
- By 2075
- 224,593 · +61.6%
- By 2100
- 250,603 · +80.3%
Race, ethnicity, and origin ACS 2023
- Neighborhood character
- Predominantly White (86%)
- Race & ethnicity
- White 86% Two or more races 7% Black 6% Hispanic / Latino 1%
- Common ancestry
- Slovak 3% Lithuanian 1% Italian 1%
- Foreign-born
- 6% · Canada
Political lean MEDSL · Faulkner
- 2024 margin
- Solid R (+32.3) · D 32.6% · R 64.9% · Other 2.5%
- 2008→2024 swing
- -7.1pp toward R · 2008: -25.3pp · 2024: -32.3pp
- All cycles
- 2024: R+32.3 2020: R+29.5 2016: R+31.6 2012: R+31.7 2008: R+25.3
Not yet ingested
- Civics
- —
Market trends
- HPI YoY
- ▲ 9.62%
- Current HPI
- 236.6197
- Rent YoY
- —
- Metro
- —
- State GDP YoY
- ▲ 3.80%
- F500 in state
- 10
Industry mix (Fortune 500 HQ in AR)
| Industry | F500 HQs | Revenue |
|---|---|---|
| Retail | 1 | $681B |
|
||
| Food / Agriculture | 1 | $53B |
|
||
| Retail / Energy | 1 | $22B |
|
||
| Transportation / Logistics | 1 | $12B |
|
||
| Energy | 1 | $4B |
|
||
Cash-flow waterfall
monthlySold comps — $/sqft
last 12 mo · ≤1 miLoading sold comps…