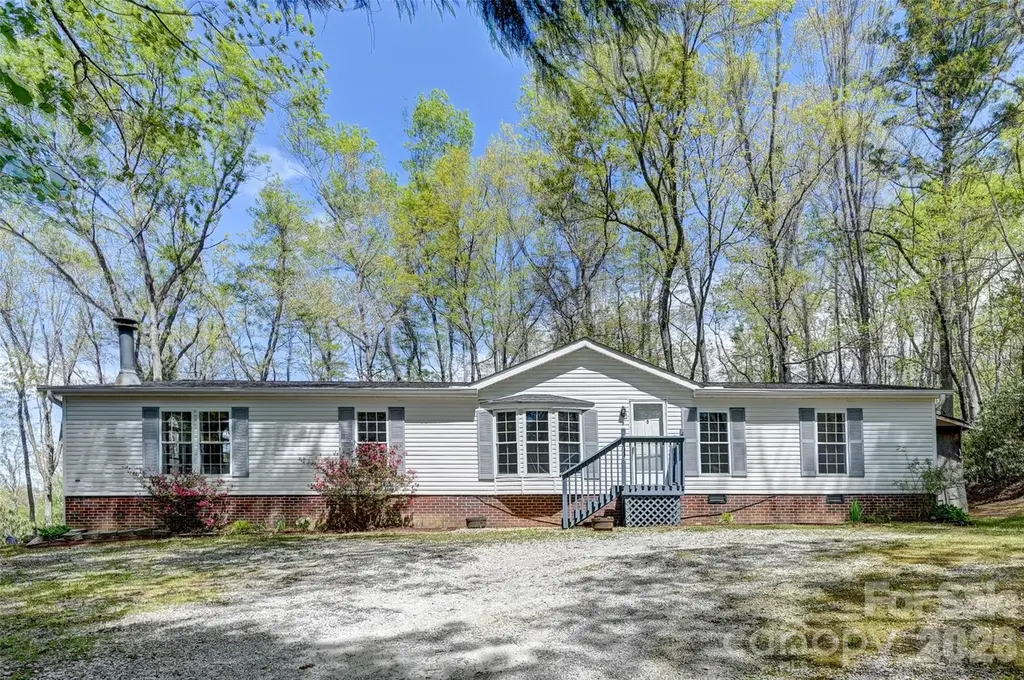
98 Fork Ridge Ln
Mountain Home, NC 28792
$280,000F
3 bd · 2.0 ba ·
1,742 sqft ·
Built 1995
· Manufactured
· Pending
· 20 DOM
Cashflow @ list (25.0% down · 7.5%)
Estimated rent
$1,702/mo
Mortgage (P&I)
−$1,468
Tax + insurance
−$185
HOA
−$0
Vac / Maint / Mgmt
−$357
Net cashflow
$-309/mo
Annual
$-3,708/yr
Cap rate
4.97%
Cash-on-cash
-4.73%
DSCR
0.79
1% rule
0.61%
Cash to close
$78,400
Investor read
- This is a 3-bed/2.0-bath manufactured listed at $280k.
- At list price, monthly cash flow is $-309 ($-4k/yr) — negative.
- To cash-flow at today's rent, offer at most $225k (19.5% below list).
- To meet the 1% rule (rent ≥ 1% of price), the offer needs to be $170k (39.2% below list).
- It's been on market 20 days — a 2% lower offer ($276k) is reasonable based on typical stale-listing flexibility.
- Recommended offer: $170k (39.2% below list) — sets the bar for 1% rule.
- Local home prices are declining (-3.0%/yr); year-one equity from $2k of loan paydown is wiped out by about $8k of value loss. Plan a longer hold.
- Location reads 59/100 on livability (#550 in NC) — a working-class tenant base; expect higher turnover. Strengths: cost of living A, housing A, crime B+; Watch: employment C-, amenities F, commute F.
- Henderson County Schools (suburban): math 48% / reading 52% proficiency, ranked #64 of 178 in NC (top 36%) — acceptable for families but not a draw, mixed tenant base, ~2y average lease.
- Zoned schools: Clear Creek Elementary (math 39% / reading 44%, grade F, #673 of 1,410 statewide, top 48%, 484 students, 70% FRL); Apple Valley Middle (math 37% / reading 44%, grade F, #215 of 475 statewide, top 46%, 825 students, 67% FRL); North Henderson High (math 72% / reading 58%, grade B, #161 of 535 statewide, top 30%, 1,146 students, 61% FRL) — zoned schools average 66% FRL vs 46% district-wide (20 pts higher); higher-poverty schools than district average — tighter screening recommended.
- Market conditions: Rents rising (+3.6%/yr); 367 active listings in the ZIP; 2 comparable units currently listed for rent nearby; 1,534 units permitted in Henderson County in 2024 (558 in 5+ unit buildings).
- Henderson County population projected at +20% by 2050 — long-run rental-demand tailwind backs the buy-and-hold thesis.
- Current owner paid $84k; list at $280k implies a 233% gain — meaningful room to come down on a strong offer.
- Cap rate 5.0% vs local median 2.7% in Mountain Home — top-decile yield for the area; either an underpriced asset or a hidden risk that comps aren't pricing in. Stress-test before assuming the spread holds.
- This rent runs 37% of the median local income ($56k/yr) — at the standard rent-burdened threshold; future hikes will face affordability resistance.
Questions for listing agent
- What do current leases actually rent for vs. the listed asking? Can we see a recent rent roll and the last 12 months of T-12 income?
- Is there a deadline driving the sale (1031 exchange, divorce, estate, relocation)? That informs how much negotiation room exists.
- Schools are F-rated, which usually means shorter tenancies and higher turnover. Who's the typical renter profile here, and what's been the actual vacancy rate?
- The area grade is low — what's the realistic commute time and amenity access for the typical tenant pool here? Any planned neighborhood developments (good or bad) we should know about?
- What's the average days-on-market for RENTAL listings here right now (not sales)? A rising rental-DOM trend means longer vacancies and softer asking-rent achievability than the comps imply.
- What's the recent tenant-quality profile in this submarket — average credit score on applications, eviction rate, late-payment / NSF rate, and stable-employment percentage? A property-management company in the area should have these aggregated.
- How much new for-sale + rental construction is in the pipeline within 1–3 miles? Heavy new supply typically softens prices + rents 12–24 months out; constrained supply supports both.
CashFlowRE · CFR-Q7X8KK56DVJ08E
· Data 1 week ago
cashflowre.app · 2026-05-29