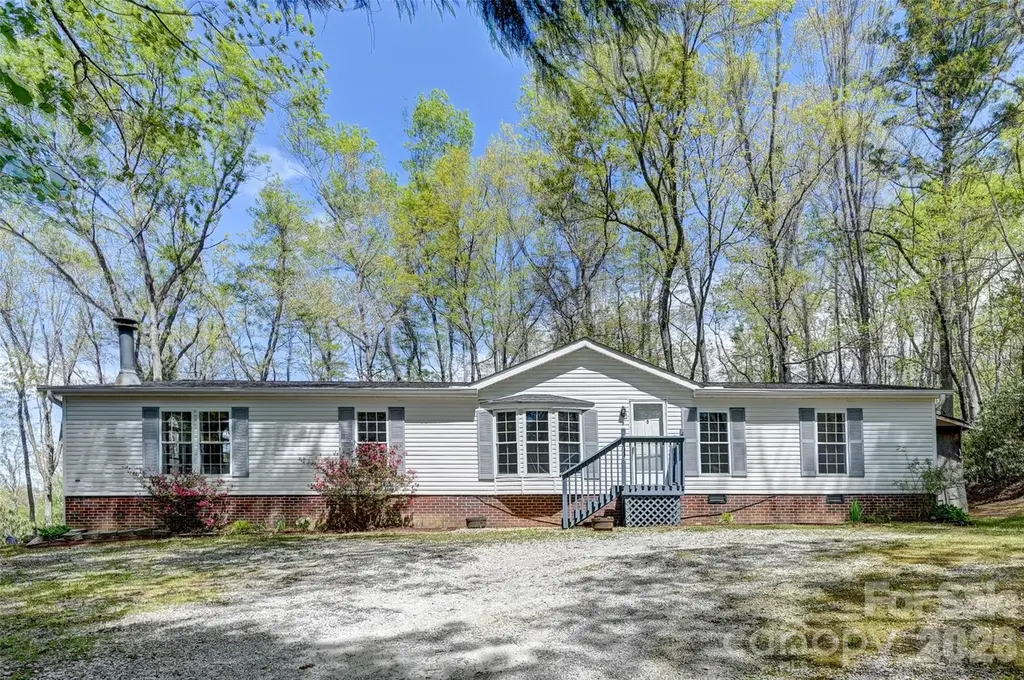
98 Fork Ridge Ln · Mountain Home, NC
Flood risk 1/10 · Minimal
- FEMA flood zone
- X (unshaded)
- Chance of flooding over 30 yrs
- 0.0%
- Est. flood insurance / yr
- $507 – $1,088
Fire risk 4/10 · Minor
- Est. fire insurance / yr
- $906 – $1,684
Heat risk 3/10 · Minor
- Hot days now (above 98°F)
- 7 days/yr
- Hot days in 30 yrs
- 18 days/yr
Wind risk 2/10 · Minimal
- Chance of severe wind over 30 yrs
- —
Air-quality risk 3/10 · Minor
- Unhealthy air days now
- 2 days/yr
- Unhealthy air days in 30 yrs
- 3 days/yr
Risk factors via First Street. Map © Google.
Why this score? — see what drove the F grade
The composite is a weighted blend of 9 inputs, each scored 0–100. Each bar is that input's sub-score; the figure is the points it added to the 100-point composite (weight × sub-score).
- Cash flow +7.8/30.0
- ARV discount +7.5/15.0
- Schools +4.2/10.0
- Rent growth +3.4/5.0
- Livability +3.0/5.0
- Condition / age +2.5/5.0
- DSCR +1.9/10.0
- 1% rule +1.1/10.0
- Appreciation +0.0/10.0
$280,000
🖨 Deal sheet (PDF) 📄 Offer letter ✓ Due diligence
Listing remarks
Only 4 Miles out of downtown Hendersonville, but it feels very remote and quiet. This 1995 3/2 manufactured doublewide is a lovely place to call home. A wood-burning fireplace in the living room and lots of light. This home has great space with a large kitchen, laundry room, and extra den space. A nice . 78 acre lot surrounded by trees. A Standard 1 yr 2-10 Home Warranty included!!! Home is only 3 miles from Walmart and 1-26. Come See this. home!
Key facts
- 0.78 acre lot
- Built 1995
- Listed 20 days
Property features AI
Finance
- HOA & community: No HOA
Exterior
- Parking: Driveway (no main-level garage)
- Security: Smoke detector(s)
- Utilities: Well water; Septic system; Electric service
- Home design: Manufactured doublewide single-family residence; One story; Completed development; Two or more access exits; Crawl space foundation; Elevation 2000 ft; Facing direction not specified
- Construction: Manufactured construction; Vinyl exterior
- Exterior features: Deck; Front porch; Back yard fencing; Private, level, wooded lot; Private maintained road; Gravel road access; Shed(s)
Interior
- Kitchen: Dishwasher; Electric oven; Refrigerator; Electric water heater
- Bedrooms: 3 bedrooms on the main level
- Flooring: Laminate flooring; Vinyl flooring
- Bathrooms: 2 full bathrooms on the main level
- Heating & cooling: Heat pump heating; Heat pump cooling; Ceiling fans
- Interior features: Insulated windows; Sliding doors; Smoke detectors
- Laundry & utility: Washer hookup; Electric dryer hookup; Mud room
Neighborhood map
What this means for you Summary
Snapshot
- This is a 3-bed/2.0-bath manufactured listed at $280k.
Deal economics
- At list price, monthly cash flow is $-309 ($-4k/yr) — negative.
- To cash-flow at today's rent, offer at most $225k (19.5% below list).
- To meet the 1% rule (rent ≥ 1% of price), the offer needs to be $170k (39.2% below list).
- Recommended offer: $170k (39.2% below list) — sets the bar for 1% rule.
- Cap rate 5.0% vs local median 2.7% in Mountain Home — top-decile yield for the area; either an underpriced asset or a hidden risk that comps aren't pricing in. Stress-test before assuming the spread holds.
Location & tenants
- Location reads 59/100 on livability (#550 in NC) — a working-class tenant base; expect higher turnover. Strengths: cost of living A, housing A, crime B+; Watch: employment C-, amenities F, commute F.
- Henderson County Schools (suburban): math 48% / reading 52% proficiency, ranked #64 of 178 in NC (top 36%) — acceptable for families but not a draw, mixed tenant base, ~2y average lease.
- Zoned schools: Clear Creek Elementary (math 39% / reading 44%, grade F, #673 of 1,410 statewide, top 48%, 484 students, 70% FRL); Apple Valley Middle (math 37% / reading 44%, grade F, #215 of 475 statewide, top 46%, 825 students, 67% FRL); North Henderson High (math 72% / reading 58%, grade B, #161 of 535 statewide, top 30%, 1,146 students, 61% FRL) — zoned schools average 66% FRL vs 46% district-wide (20 pts higher); higher-poverty schools than district average — tighter screening recommended.
- Market conditions: Rents rising (+3.6%/yr); 364 active listings in the ZIP; 2 comparable units currently listed for rent nearby; 1,534 units permitted in Henderson County in 2024 (558 in 5+ unit buildings).
- This rent runs 37% of the median local income ($56k/yr) — at the standard rent-burdened threshold; future hikes will face affordability resistance.
Forward outlook
- Local home prices are declining (-3.0%/yr); year-one equity from $2k of loan paydown is wiped out by about $8k of value loss. Plan a longer hold.
- Henderson County population projected at +20% by 2050 — long-run rental-demand tailwind backs the buy-and-hold thesis.
Negotiation context
- It's been on market 20 days — a 2% lower offer ($276k) is reasonable based on typical stale-listing flexibility.
- Current owner paid $84k; list at $280k implies a 233% gain — meaningful room to come down on a strong offer.
Questions for the listing agent
- What do current leases actually rent for vs. the listed asking? Can we see a recent rent roll and the last 12 months of T-12 income?
- Is there a deadline driving the sale (1031 exchange, divorce, estate, relocation)? That informs how much negotiation room exists.
- Schools are F-rated, which usually means shorter tenancies and higher turnover. Who's the typical renter profile here, and what's been the actual vacancy rate?
- The area grade is low — what's the realistic commute time and amenity access for the typical tenant pool here? Any planned neighborhood developments (good or bad) we should know about?
- What's the average days-on-market for RENTAL listings here right now (not sales)? A rising rental-DOM trend means longer vacancies and softer asking-rent achievability than the comps imply.
- What's the recent tenant-quality profile in this submarket — average credit score on applications, eviction rate, late-payment / NSF rate, and stable-employment percentage? A property-management company in the area should have these aggregated.
- How much new for-sale + rental construction is in the pipeline within 1–3 miles? Heavy new supply typically softens prices + rents 12–24 months out; constrained supply supports both.
Investment metrics
- 1% rule
- 0.61% ✗
- Cap rate
- 4.97%
- Cash-on-cash
- -4.73%
- DSCR
- 0.79
- GRM
- 13.7
CMA / ARV
No comps found within radius.
Projected returns pro-forma
-3.0% appreciation · 3.63% rent growth · sell at horizon
- IRR
- -23.8%
- Equity multiple
- 0.18×
- Total profit
- $-64,116
- Equity at exit
- $41,749
- IRR
- -17.7%
- Equity multiple
- 0.01×
- Total profit
- $-77,260
- Equity at exit
- $24,209
Cash invested: $78,400 (down + closing). Projections, not guarantees.
Landlord ↔ Tenant lean methodology
- Overall (STATE)
- 85 Strongly Landlord-Friendly
- State North Carolina
- 85 Strongly Landlord-Friendly · R+3
- County
- — inherits STATE
- City
- — inherits STATE
ZIP-level market 28792
- Rents YoY
- 3.6%
- Active inventory
- 364
- Price-to-rent
- 13.7×
Monthly cashflow live
- Estimated rent
- $1,702 medium interval (Pro) →
- Mortgage (P&I)
- −$1,468
- Tax from tax record
- −$69 /mo · $825/yr
- Insurance
- −$117
- HOA
- −$0
- Lot rent leased land?
- −$0
- Vacancy / Maint / Mgmt
- −$357
- Net cashflow
- $-309
Break-even live
Sensitivity live
| Price | -10% $-151 | -5% $-230 | +0% $-309 | +5% $-388 | +10% $-468 |
|---|---|---|---|---|---|
| Rent | -10% $-444 | -5% $-376 | +0% $-309 | +5% $-242 | +10% $-175 |
| Rate | -1.0pp $-168 | -0.5pp $-238 | base $-309 | +0.5pp $-382 | +1.0pp $-455 |
UW: 25.0% down · 7.5% · 30yr · 1.5% tax · 5.0% vac · 8.0% maint · 8.0% mgmt
Financing live
Cash to close
- Down payment
- $70,000
- Closing costs
- $8,400
- Reserves months
- —
- Total cash needed
- —
Loan-product check · same deal, 3 products live
Conventional
25% down · 7.5% · 30yr
- Down + closing
- —
- Monthly P&I
- —
- Monthly cashflow
- —
- DSCR
- —
- Eligible?
- —
Personal DTI + credit; lowest rate.
DSCR
20% down · 8.5% · 30yr
- Down + closing
- —
- Monthly P&I
- —
- Monthly cashflow
- —
- DSCR
- —
- Eligible?
- —
No personal income docs; deal must DSCR.
Hard money
10% down · 12.0% · 12mo
- Down + closing
- —
- Monthly P&I
- —
- Monthly cashflow
- —
- DSCR
- —
- Eligible?
- —
Short-term bridge; refi at stabilization.
Rent comps 2 comps
| Address | Beds | Baths | Sqft | Rent | $/sqft | DOM | Units | Dist |
|---|---|---|---|---|---|---|---|---|
| 2168 Howard Gap Rd Apt 10 Hendersonville, NC | 2.0 | 1.5 | 1200 | $1,495 | $1.25 | 25d | 1 | 0.21mi |
| 48 N Rowe Rd Hendersonville, NC | 3.0 | 2.0 | 1550 | $2,495 | $1.61 | 16d | 1 | 0.21mi |
Listing history 4 events
-
2026-05-13status Pending
-
2026-04-24$280,000 Active
-
2026-04-17historical $280,000
-
2006-02-01soldstatus $84,000
ⓘ Source: listings_history table (triggers on properties + properties_extension) + one-shot
backfill from property_details.listing_events for pre-trigger history.
Tax reassessment forecast NC · Resets to sale price
- Current annual tax
- $825 · $69/mo
- Projected year-2 tax
- $2,296 · $191/mo
- Expected delta
- +$1,471/yr (+$123/mo · 178.3%)
ⓘ Screening estimate from a state-policy table — verify with the county assessor before closing.
Climate risk First Street
- Flood 1/10 Low FEMA zone X (unshaded) · 0% chance over 30 yrs
- Wildfire 4/10 Moderate
- Heat 3/10 Moderate 7 d/yr ≥98°F today · 18 d/yr by 30 yrs out
- Wind 2/10 Low
- Air quality 3/10 Moderate 2 unhealthy d/yr today · 3 by 30 yrs out
Nearby sold comps map
Loading sold comps map…
Walkable amenities ~0.75 mi
Loading nearby amenities…
Taxation est. · year 1
- Rental income
- $20,426
- − Mortgage interest
- −$15,684
- − Property taxes
- −$825
- − Insurance
- −$1,400
- − Repairs & maintenance
- −$1,634
- − Management
- −$1,634
- − Depreciation
- −$8,145
- Taxable loss
- −$8,897
- Est. tax savings @ 24.0%
- +$2,135
- After-tax cash flow
- $-1,573/yr
For passive investors: Depreciation is non-cash, so a rental often shows a tax loss while cash-flowing — sheltering income. Rental losses are passive: they offset passive income freely, and up to $25,000/yr can offset ordinary (W-2) income if you actively participate and your MAGI is under $100k (phasing out to $0 by $150k); unused losses carry forward. On sale, claimed depreciation is recaptured at up to 25%, and gains may owe capital-gains tax (a 1031 exchange can defer both). Figures are a year-1 estimate at your 24.0% rate — not tax advice; consult a CPA.
Schools (NCES district)
- District
- Henderson County Schools
- NCES district ID
- 3702100
- Math proficiency
- 48% ▼ -2.00%
- Reading proficiency
- 52% ▼ -2.00%
- Median HH income
- $47,101
- Composite
- 42.5/100
- National rank
- #3206
- State rank
- #64 of 178 in NC
Livability — Mountain Home
- Score
- 59/100
- State rank
- #550
- US rank
- #20251
Category grades
Schools grade is shown separately in the Schools card above.
Census & demographics
- County
- Henderson County · 78,587 people
- City population
- 43
- Metro
- Asheville, NC
- Population (ZIP)
- 36,645
- Household income
- $55,522
- Rent vs Own
- Severe rent burden
- 1420.0
Population outlook (Henderson County) Hauer SSP2
- Today (2025)
- 124,075 people
- By 2030
- 129,690 · +4.5%
- By 2040
- 139,898 · +12.8%
- By 2050
- 148,298 · +19.5%
- By 2075
- 163,980 · +32.2%
- By 2100
- 166,962 · +34.6%
Race, ethnicity, and origin ACS 2023
- Neighborhood character
- Predominantly White (72%)
- Race & ethnicity
- White 72% Hispanic / Latino 20% Two or more races 8% Black 4% Native American 1%
- Hispanic origin (detail)
- Mexican 15% Puerto Rican 1%
- Common ancestry
- Slovak 3% Serbian 2% Lithuanian 2%
- Foreign-born
- 10% · Canada, Jamaica
- Languages at home
- 82% English-only · Spanish 16%
Political lean MEDSL · Henderson
- 2024 margin
- R (+14.6) · D 42.1% · R 56.7% · Other 1.1%
- 2008→2024 swing
- +6.5pp toward D · 2008: -21.0pp · 2024: -14.6pp
- All cycles
- 2024: R+14.6 2020: R+18.8 2016: R+27.9 2012: R+27.6 2008: R+21.0
Not yet ingested
- Civics
- —
Market trends
- HPI YoY
- ▼ -174.29%
- Current HPI
- 214.0215
- Rent YoY
- ▲ 3.63%
- Metro
- Asheville, NC
- State GDP YoY
- ▲ 3.28%
- F500 in state
- 26
Industry mix (Fortune 500 HQ in NC)
| Industry | F500 HQs | Revenue |
|---|---|---|
| Financial Services | 2 | $213B |
|
||
| Retail | 2 | $95B |
|
||
| Industrial Conglomerate | 1 | $38B |
|
||
| Metals / Steel | 1 | $35B |
|
||
| Utilities | 1 | $30B |
|
||
| Industrial Machinery | 1 | $19B |
|
||
Price history
+233.3% since first listed4 events — show timeline
- 2026-05-13 Pending — CANOPYMLS as Distributed by MLS Grid
- 2026-04-24 Listed $280,000 CANOPYMLS as Distributed by MLS Grid
- 2026-04-17 Coming Soon $280,000 CANOPYMLS as Distributed by MLS Grid
- 2006-02-01 Sold (Public Records) $84,000 Public Records
Property tax history
+4.8%/yrLatest (2025): $825 · +0.0% YoY. Source: county tax records.
Cash-flow waterfall
monthlySold comps — $/sqft
last 12 mo · ≤1 miLoading sold comps…