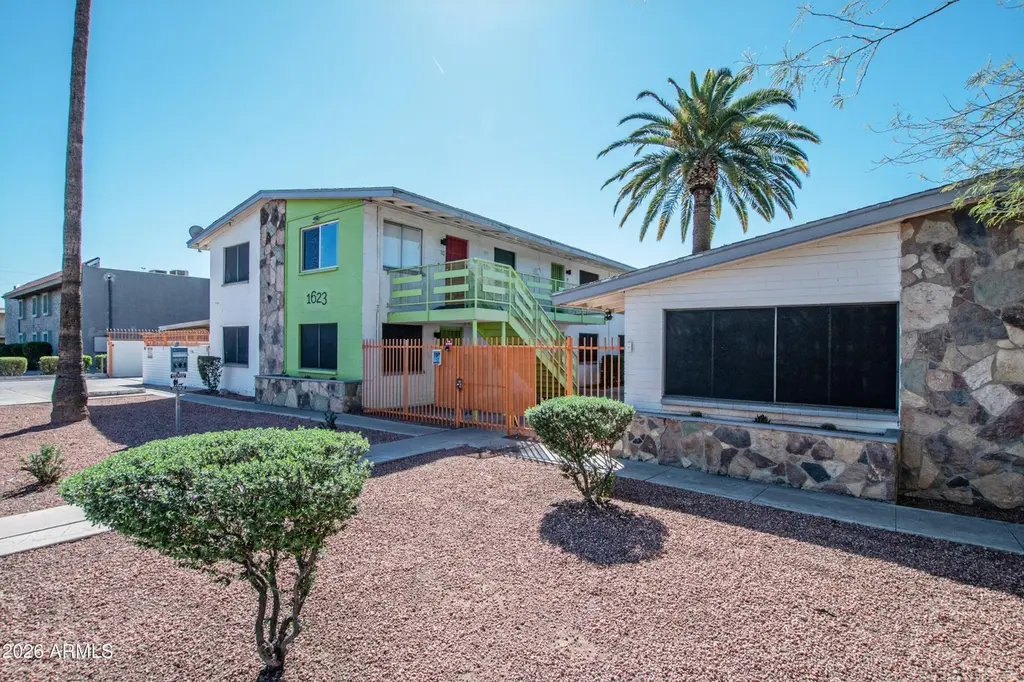
1623 W Missouri Ave
Phoenix, AZ 85015
$4,450,000F
None bd · None ba ·
1,831 sqft ·
Built 1964
· MultiFamily
· Active
· 23 DOM
Cashflow @ list (25.0% down · 7.5%)
Estimated rent
$37,130/mo
Mortgage (P&I)
−$23,336
Tax + insurance
−$7,417
HOA
−$0
Vac / Maint / Mgmt
−$7,797
Net cashflow
$-1,420/mo
Annual
$-17,043/yr
Cap rate
5.91%
Cash-on-cash
-1.37%
DSCR
0.94
1% rule
0.83%
Cash to close
$1,246,000
Investor read
- This is a 29 × 1-bed/1-bath units multifamily listed at $4.45M.
- At list price, monthly cash flow is $-1k ($-17k/yr) — negative. Per door: $-49/mo.
- To cash-flow at today's rent, offer at most $4.24M (4.6% below list).
- To meet the 1% rule (rent ≥ 1% of price), the offer needs to be $3.71M (16.6% below list).
- It's been on market 23 days — a 2% lower offer ($4.38M) is reasonable based on typical stale-listing flexibility.
- Recommended offer: $3.71M (16.6% below list) — sets the bar for 1% rule.
- Local home prices are declining (-3.0%/yr); year-one equity from $31k of loan paydown is wiped out by about $134k of value loss. Plan a longer hold.
- Location reads 75/100 on livability (#16 in AZ, #3,924 nationally) — a middle-class / working-renter tenant base. Strengths: amenities A+, commute A+, housing A+; Watch: health & safety C-, crime F.
- Phoenix Union High School District (4286) (urban): math 10% / reading 15% proficiency, ranked #224 of 249 in AZ (top 90%) — low school quality limits family demand, transient renter base, plan for 1-2y turnover.
- Market conditions: Rents falling (-3.7%/yr); 160 active listings in the ZIP; 40 comparable units currently listed for rent nearby; rentals leasing fast (median 2d on market — plan ~1-2 weeks tenant-placement turnaround); 36,011 units permitted in Maricopa County in 2024 (12,801 in 5+ unit buildings).
- Maricopa County population projected at +38% by 2050 — long-run rental-demand tailwind backs the buy-and-hold thesis.
- 3 sale attempts since 4y ago with the ask held roughly flat each time — persistent listings suggest the price (not the market) is what's stuck; bring a comps-based counter.
- Current owner paid $2.60M; list at $4.45M implies a 71% gain — meaningful room to come down on a strong offer.
- Climate carrying-cost: extreme-heat days projected 6→17/yr by 2055 (HVAC capex compounding) — expect insurance premiums to compound above CPI over the hold.
- Cap rate 5.9% vs local median 3.3% in Phoenix — top-decile yield for the area; either an underpriced asset or a hidden risk that comps aren't pricing in. Stress-test before assuming the spread holds.
- At $37,130/mo this rent would consume 812% of the median local household income ($55k/yr) (locally 3390% of renters already pay >50% of income on rent) — very limited rent-growth headroom before tenants either downsize or default.
Questions for listing agent
- What do current leases actually rent for vs. the listed asking? Can we see a recent rent roll and the last 12 months of T-12 income?
- Can we see the unit-by-unit rent roll, current vacancy, and any below-market leases? What's the average tenancy length?
- What capital expenditures (roof, boiler, parking lot, exteriors) have been made in the last 5 years, and what's planned in the next 2?
- Built in 1964 — when were the roof, HVAC, electrical panel, plumbing, and water heater last replaced?
- Is there a deadline driving the sale (1031 exchange, divorce, estate, relocation)? That informs how much negotiation room exists.
- Crime grade is F in this area — have there been break-ins, vandalism, or insurance claims at this property in the last 3 years? What carrier currently insures it and at what premium?
- The area grade is low — what's the realistic commute time and amenity access for the typical tenant pool here? Any planned neighborhood developments (good or bad) we should know about?
- What's the average days-on-market for RENTAL listings here right now (not sales)? A rising rental-DOM trend means longer vacancies and softer asking-rent achievability than the comps imply.
CashFlowRE · CFR-Q8882NCSF4MMBR
· Data 2 days ago
cashflowre.app · 2026-05-29