 29-Plex
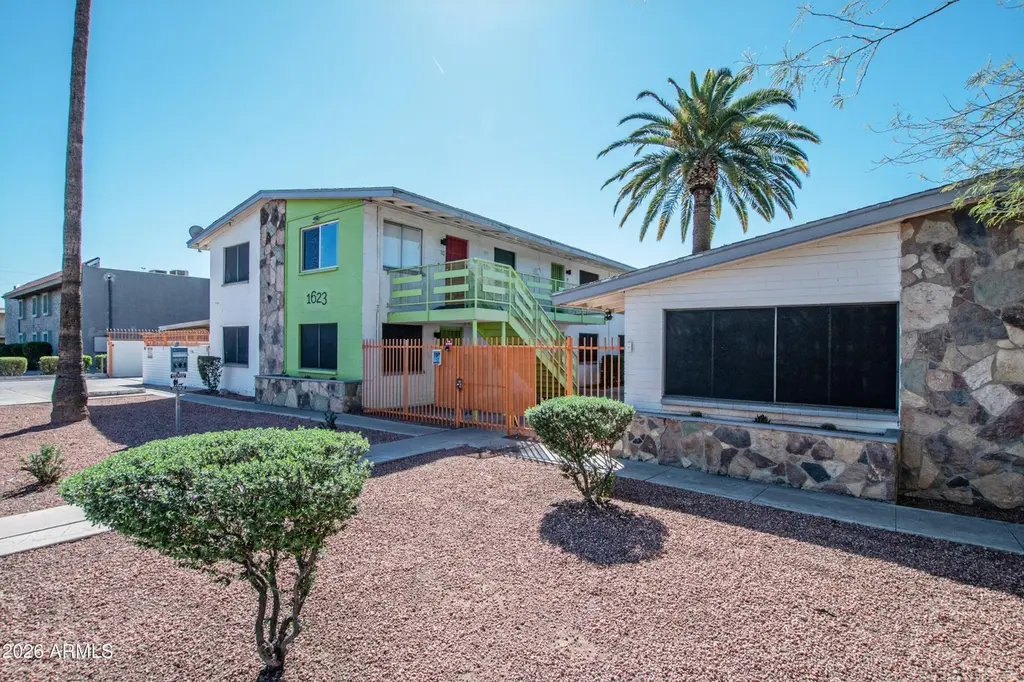
1623 W Missouri Ave · Phoenix, AZ
Flood risk 1/10 · Minimal
- FEMA flood zone
- X (shaded)
- Chance of flooding over 30 yrs
- 0.0%
- Est. flood insurance / yr
- $507 – $1,088
Fire risk 1/10 · Minimal
- Est. fire insurance / yr
- $610 – $1,132
Heat risk 9/10 · Severe
- Hot days now (above 112°F)
- 6 days/yr
- Hot days in 30 yrs
- 17 days/yr
Wind risk 1/10 · Minimal
- Chance of severe wind over 30 yrs
- —
Air-quality risk 3/10 · Minor
- Unhealthy air days now
- 3 days/yr
- Unhealthy air days in 30 yrs
- 3 days/yr
Risk factors via First Street. Map © Google.
Why this score? — see what drove the F grade
The composite is a weighted blend of 9 inputs, each scored 0–100. Each bar is that input's sub-score; the figure is the points it added to the 100-point composite (weight × sub-score).
- Cash flow +11.6/30.0
- ARV discount +7.5/15.0
- Livability +3.8/5.0
- DSCR +3.4/10.0
- 1% rule +3.3/10.0
- Condition / age +2.5/5.0
- Rent growth +1.6/5.0
- Schools +1.1/10.0
- Appreciation +0.0/10.0
$4,450,000
🖨 Deal sheet 📄 Offer letter ✓ Due diligence
Multi-family units
County records classify this as Multi-Family (5+ Unit). Listing-text estimate: 29 units. confirmed
5+ unit building — per-unit beds/baths from public records are typically unavailable; the breakdown below (if shown) is an estimate from the listing text.
Listing remarks
The Gem on Missouri is a 29-unit multifamily community positioned in the highly desirable Midtown Phoenix submarket. Located at 1623 & 1625 W Missouri Ave, the property was originally constructed in 1963 and spans approximately ±22,400 square feet, with an average unit size of ±772 SF, offering efficient and functional floor plans that appeal to a broad renter base. The property is currently achieving average rents of approximately $1,074, below market comparables averaging $1,317, representing upside of approximately $243 per unit. The asset has already undergone comprehensive interior renovations, including upgraded finishes and in-unit washer and dryer across all unit
Key facts
- Upgraded finishes
- 39 parking spots
- Pool
Tags
Property features AI
Finance
- HOA & community: Community amenities: barbecue, exercise room, pool
Exterior
- Parking: 39 total parking spaces; 29 covered spaces; 10 open spaces; Paved parking with carports; Free parking; Approximately 1 space per unit
- Utilities: Master water meter; Public sewer; Individual electric meters
- Home design: Fee simple ownership; Eight buildings on the property
- Construction: Painted block construction; Composition roof
- Exterior features: Private pool; Concrete road access; Barbecue area (community); Exercise room (community); Pool (community)
Interior
- Kitchen: Built-in range; Free-standing range; Dishwasher; Refrigerator; Microwave; Disposal
- Flooring: Vinyl flooring
- Heating & cooling: Heating present (other); Individual cooling with ceiling fans
- Interior features: Built-in range, Free-standing range, Disposal, Dishwasher, Refrigerator, Microwave; Private pool (on property); Ceiling fans in individual units
- Laundry & utility: Washer and dryer included; Individual electric meters
Neighborhood map
What this means for you Summary
Snapshot
- This is a 29 × 1-bed/1-bath units multifamily listed at $4.45M.
Deal economics
- At list price, monthly cash flow is $-1k ($-17k/yr) — negative. Per door: $-49/mo.
- To cash-flow at today's rent, offer at most $4.24M (4.6% below list).
- To meet the 1% rule (rent ≥ 1% of price), the offer needs to be $3.71M (16.6% below list).
- Recommended offer: $3.71M (16.6% below list) — sets the bar for 1% rule.
- Cap rate 5.9% vs local median 3.3% in Phoenix — top-decile yield for the area; either an underpriced asset or a hidden risk that comps aren't pricing in. Stress-test before assuming the spread holds.
Location & tenants
- Location reads 75/100 on livability (#16 in AZ, #3,924 nationally) — a middle-class / working-renter tenant base. Strengths: amenities A+, commute A+, housing A+; Watch: health & safety C-, crime F.
- Phoenix Union High School District (4286) (urban): math 10% / reading 15% proficiency, ranked #224 of 249 in AZ (top 90%) — low school quality limits family demand, transient renter base, plan for 1-2y turnover.
- Market conditions: Rents falling (-3.7%/yr); 160 active listings in the ZIP; 40 comparable units currently listed for rent nearby; rentals leasing fast (median 1d on market — plan ~1-2 weeks tenant-placement turnaround); 36,011 units permitted in Maricopa County in 2024 (12,801 in 5+ unit buildings).
- At $37,130/mo this rent would consume 812% of the median local household income ($55k/yr) (locally 3390% of renters already pay >50% of income on rent) — very limited rent-growth headroom before tenants either downsize or default.
Forward outlook
- Local home prices are declining (-3.0%/yr); year-one equity from $31k of loan paydown is wiped out by about $134k of value loss. Plan a longer hold.
- Maricopa County population projected at +38% by 2050 — long-run rental-demand tailwind backs the buy-and-hold thesis.
Negotiation context
- It's been on market 23 days — a 2% lower offer ($4.38M) is reasonable based on typical stale-listing flexibility.
- 3 sale attempts since 4y ago with the ask held roughly flat each time — persistent listings suggest the price (not the market) is what's stuck; bring a comps-based counter.
- Current owner paid $2.60M; list at $4.45M implies a 71% gain — meaningful room to come down on a strong offer.
Risks & watch-outs
- Climate carrying-cost: extreme-heat days projected 6→17/yr by 2055 (HVAC capex compounding) — expect insurance premiums to compound above CPI over the hold.
Questions for the listing agent
- What do current leases actually rent for vs. the listed asking? Can we see a recent rent roll and the last 12 months of T-12 income?
- Can we see the unit-by-unit rent roll, current vacancy, and any below-market leases? What's the average tenancy length?
- What capital expenditures (roof, boiler, parking lot, exteriors) have been made in the last 5 years, and what's planned in the next 2?
- Built in 1964 — when were the roof, HVAC, electrical panel, plumbing, and water heater last replaced?
- Is there a deadline driving the sale (1031 exchange, divorce, estate, relocation)? That informs how much negotiation room exists.
- Crime grade is F in this area — have there been break-ins, vandalism, or insurance claims at this property in the last 3 years? What carrier currently insures it and at what premium?
- The area grade is low — what's the realistic commute time and amenity access for the typical tenant pool here? Any planned neighborhood developments (good or bad) we should know about?
- What's the average days-on-market for RENTAL listings here right now (not sales)? A rising rental-DOM trend means longer vacancies and softer asking-rent achievability than the comps imply.
- What's the recent tenant-quality profile in this submarket — average credit score on applications, eviction rate, late-payment / NSF rate, and stable-employment percentage? A property-management company in the area should have these aggregated.
- How much new apartment / multifamily construction is in the pipeline within 1–3 miles? Heavy new supply (>2% of stock underway) typically softens rents 12–24 months out; light construction supports rent growth.
Investment metrics
- 1% rule
- 0.83% ✗
- Cap rate
- 5.91%
- Cash-on-cash
- -1.37%
- DSCR
- 0.94
- GRM
- 10.0
CMA / ARV
- ARV (on-the-fly)
- $479,722
- Comps found
- 1
Show comp detail 1 sale within ~0.75 mi
| Address | Dist | Beds/Ba | Sqft | Sold | Price | $/sf | Match |
|---|---|---|---|---|---|---|---|
| 5040 N 18th Ave | 0.43mi | 4/3.0 | 1,984 (+8%) | 23mo | $520,000 | $262 | 47 |
Match score weights: distance 35% · size 25% · config 20% · recency 20%. Top-matched comps best support the ARV.
Projected returns pro-forma
-3.0% appreciation · 0.0% rent growth · sell at horizon
- IRR
- -22.0%
- Equity multiple
- 0.26×
- Total profit
- $-919,801
- Equity at exit
- $663,509
- IRR
- -25.5%
- Equity multiple
- -0.07×
- Total profit
- $-1,335,669
- Equity at exit
- $384,755
Cash invested: $1,246,000 (down + closing). Projections, not guarantees.
Landlord ↔ Tenant lean methodology
- Overall (STATE)
- 87 Strongly Landlord-Friendly
- State Arizona
- 87 Strongly Landlord-Friendly · R+3
- County
- — inherits STATE
- City
- — inherits STATE
ZIP-level market 85015
- Home prices YoY
- -15.3%
- Rents YoY
- -3.7%
- Active inventory
- 160
- Price-to-rent
- 289.6×
Monthly cashflow live
- Estimated rent
- $37,130 high interval (Pro) →
- Mortgage (P&I)
- −$23,336
- Tax est. 1.5%
- −$5,562 /mo · $66,750/yr
- Insurance
- −$1,854
- HOA
- −$0
- Vacancy / Maint / Mgmt
- −$7,797
- Net cashflow
- $-1,420
Break-even live
29-unit breakdown (identical units grouped — click to expand)
| Units | Beds | Baths | Est. rent |
|---|---|---|---|
| 29× units | 1 | 1 | $37,120 |
| #1 | 1 | 1 | $1,280 |
| #2 | 1 | 1 | $1,280 |
| #3 | 1 | 1 | $1,280 |
| #4 | 1 | 1 | $1,280 |
| #5 | 1 | 1 | $1,280 |
| #6 | 1 | 1 | $1,280 |
| #7 | 1 | 1 | $1,280 |
| #8 | 1 | 1 | $1,280 |
| #9 | 1 | 1 | $1,280 |
| #10 | 1 | 1 | $1,280 |
| #11 | 1 | 1 | $1,280 |
| #12 | 1 | 1 | $1,280 |
| #13 | 1 | 1 | $1,280 |
| #14 | 1 | 1 | $1,280 |
| #15 | 1 | 1 | $1,280 |
| #16 | 1 | 1 | $1,280 |
| #17 | 1 | 1 | $1,280 |
| #18 | 1 | 1 | $1,280 |
| #19 | 1 | 1 | $1,280 |
| #20 | 1 | 1 | $1,280 |
| #21 | 1 | 1 | $1,280 |
| #22 | 1 | 1 | $1,280 |
| #23 | 1 | 1 | $1,280 |
| #24 | 1 | 1 | $1,280 |
| #25 | 1 | 1 | $1,280 |
| #26 | 1 | 1 | $1,280 |
| #27 | 1 | 1 | $1,280 |
| #28 | 1 | 1 | $1,280 |
| #29 | 1 | 1 | $1,280 |
| Total (29 units) | $37,130 | ||
UW: 25.0% down · 7.5% · 30yr · 1.5% tax · 5.0% vac · 8.0% maint · 8.0% mgmt
Financing live
Cash to close
- Down payment
- $1,112,500
- Closing costs
- $133,500
- Reserves months
- —
- Total cash needed
- —
Loan-product check · same deal, 3 products live
Conventional
25% down · 7.5% · 30yr
- Down + closing
- —
- Monthly P&I
- —
- Monthly cashflow
- —
- DSCR
- —
- Eligible?
- —
Personal DTI + credit; lowest rate.
DSCR
20% down · 8.5% · 30yr
- Down + closing
- —
- Monthly P&I
- —
- Monthly cashflow
- —
- DSCR
- —
- Eligible?
- —
No personal income docs; deal must DSCR.
Hard money
10% down · 12.0% · 12mo
- Down + closing
- —
- Monthly P&I
- —
- Monthly cashflow
- —
- DSCR
- —
- Eligible?
- —
Short-term bridge; refi at stabilization.
Rent comps 40 comps
| Address | Beds | Baths | Sqft | Rent | $/sqft | DOM | Units | Dist |
|---|---|---|---|---|---|---|---|---|
| 1851 W Vermont Ave Phoenix, AZ | 2.0 | 2.5 | 1847 | $1,850 | $1.00 | 1d | 1 | 0.33mi |
| 5620 N 19th Ave Phoenix, AZ | 2.0 | 3.5 | 1344 | $1,900 | $1.41 | 1d | 1 | 0.39mi |
| 1226 W Rancho Dr Phoenix, AZ | 3.0 | 2.0 | 1584 | $2,799 | $1.77 | 1d | 1 | 0.45mi |
| 5015 N 13th Ave Phoenix, AZ | 3.0 | 2.0 | 1312 | $2,350 | $1.79 | 12d | 1 | 0.55mi |
| 902 W Oregon Ave Phoenix, AZ | 3.0 | 2.0 | 1478 | $3,200 | $2.17 | 1d | 1 | 0.56mi |
| 1514 W Rovey Ave Phoenix, AZ | 3.0 | 2.0 | 1642 | $1,995 | $1.21 | 11d | 1 | 0.57mi |
| 1507 W Berridge Ln Phoenix, AZ | 3.0 | 2.0 | 1302 | $1,886 | $1.45 | 13d | 1 | 0.61mi |
| 1540 W Berridge Ln Phoenix, AZ | 3.0 | 2.0 | 1320 | $2,795 | $2.12 | 1d | 1 | 0.63mi |
| 920 W Solcito Ln Unit 920 Phoenix, AZ | 2.0 | 2.0 | 1465 | $2,395 | $1.63 | 17d | 1 | 0.72mi |
| 920 W Solcito Ln Unit 920 Phoenix, AZ | 2.0 | 2.0 | 1465 | $2,395 | $1.63 | 1d | 1 | 0.72mi |
| 703 W Palo Verde Dr Phoenix, AZ | 3.0 | 2.0 | 1521 | $2,995 | $1.97 | 14d | 1 | 0.76mi |
| 500 W Missouri Ave Phoenix, AZ | 2.0 | 2.5 | 1322 | $2,395 | $1.81 | 1d | 1 | 0.80mi |
| 1555 W Hazelwood St Phoenix, AZ | 3.0 | 2.5 | 1584 | $2,300 | $1.45 | 1d | 1 | 0.90mi |
| 500 W Camelback Rd Phoenix, AZ | 1.0–3.0 | 1.0–3.0 | 1133 | $2,536 | $2.24 | 1d | 26 | 0.91mi |
| 537 W Mariposa St Phoenix, AZ | 3.0 | 2.0 | 1507 | $2,400 | $1.59 | 1d | 1 | 0.95mi |
| 777 W Coolidge St Phoenix, AZ | 2.0 | 2.5 | 1325 | $2,500 | $1.89 | 1d | 3 | 0.96mi |
| 777 W Coolidge St Unit 16 Phoenix, AZ | 2.0 | 2.5 | 1325 | $2,599 | $1.96 | 1d | 1 | 0.96mi |
| 775 W Coolidge St Unit 6 Phoenix, AZ | 2.0 | 2.5 | 1300 | $2,699 | $2.08 | 14d | 1 | 0.97mi |
| 4522 N 15th Ave Phoenix, AZ | 3.0 | 2.5 | 1584 | $1,800 | $1.14 | 1d | 1 | 0.97mi |
| 6027 N 23rd Ave Phoenix, AZ | 1.0–3.0 | 1.0–2.0 | 995 | $1,325 | $1.33 | 1d | 1 | 0.98mi |
| 6501 N 17th Ave #101 Phoenix, AZ | 2.0 | 1.5 | 1320 | $1,575 | $1.19 | 1d | 1 | 1.00mi |
| 40 W Medlock Dr Phoenix, AZ | 3.0 | 2.0 | 2001 | $4,200 | $2.10 | 2d | 1 | 1.01mi |
| 385 W Pierson St Unit E5 Phoenix, AZ | 1.0 | 2.0 | 1244 | $2,250 | $1.81 | 1d | 1 | 1.04mi |
| 6548 N 15th Dr Phoenix, AZ | 3.0 | 2.5 | 1881 | $2,950 | $1.57 | 1d | 1 | 1.07mi |
| 1511 W Sierra Vista Dr Phoenix, AZ | 3.0 | 2.5 | 2068 | $3,150 | $1.52 | 22d | 1 | 1.08mi |
| 1802 W Maryland Ave Phoenix, AZ | 1.0–3.0 | 1.0–2.0 | 994 | $1,516 | $1.53 | 1d | 23 | 1.09mi |
| 6564 N 15th Dr Phoenix, AZ | 3.0 | 2.5 | 2068 | $3,250 | $1.57 | 10d | 1 | 1.09mi |
| 6564 N 15th Dr Phoenix, AZ | 3.0 | 2.5 | 2068 | $3,250 | $1.57 | 1d | 1 | 1.09mi |
| 1530 W Sierra Vista Dr Phoenix, AZ | 3.0 | 2.5 | 1881 | $2,950 | $1.57 | 1d | 1 | 1.10mi |
| 6521 N 19th Dr Phoenix, AZ | 3.0 | 2.0 | 1395 | $2,295 | $1.65 | 1d | 1 | 1.11mi |
| 2025 W Campbell Ave Phoenix, AZ | 3.0 | 2.0 | 1607 | $1,961 | $1.22 | 10d | 1 | 1.13mi |
| 325 W Highland Ave Phoenix, AZ | 3.0 | 2.0 | 1656 | $2,500 | $1.51 | 1d | 1 | 1.16mi |
| 21 W Pasadena Ave #5 Phoenix, AZ | 2.0 | 2.5 | 1713 | $2,400 | $1.40 | 19d | 1 | 1.17mi |
| 4630 N 23rd Ave Phoenix, AZ | 2.0–3.0 | 2.5 | 1643 | $2,150 | $1.31 | 1d | 9 | 1.17mi |
| 171 W Highland Ave Phoenix, AZ | 3.0 | 2.0 | 1300 | $2,300 | $1.77 | 10d | 1 | 1.22mi |
| 4319 N 15th Ave Phoenix, AZ | 3.0 | 2.0 | 1385 | $1,836 | $1.33 | 14d | 1 | 1.22mi |
| 2001 W Turney Ave Unit 6 Phoenix, AZ | 2.0 | 1.0 | 1620 | $1,900 | $1.17 | 1d | 1 | 1.24mi |
| 2311 W Maryland Ave Phoenix, AZ | 3.0 | 1.5 | 1563 | $1,676 | $1.07 | 1d | 1 | 1.30mi |
| 1407 W Glenrosa Ave Phoenix, AZ | 2.0 | 2.0 | 1976 | $2,500 | $1.27 | 1d | 1 | 1.30mi |
| 314 W Maryland Ave Unit A Phoenix, AZ | 2.0 | 2.0 | 1296 | $1,874 | $1.45 | 1d | 1 | 1.31mi |
Listing history 30 events
-
2026-06-18days on market $4,450,000 Active 23 DOM
-
2026-06-17days on market $4,450,000 Active 22 DOM
-
2026-06-16days on market $4,450,000 Active 21 DOM
-
2026-06-15days on market $4,450,000 Active 20 DOM
-
2026-06-13days on market $4,450,000 Active 18 DOM
-
2026-06-13days on market $4,450,000 Active 17 DOM
-
2026-06-09days on market $4,450,000 Active 14 DOM
-
2026-06-08days on market $4,450,000 Active 13 DOM
-
2026-06-07days on market $4,450,000 Active 12 DOM
-
2026-06-04days on market $4,450,000 Active 9 DOM
-
2026-06-03days on market $4,450,000 Active 8 DOM
-
2026-06-02days on market $4,450,000 Active 7 DOM
-
2026-06-01days on market $4,450,000 Active 6 DOM
-
2026-05-31days on market $4,450,000 Active 5 DOM
-
2026-05-26$4,450,000 Active
-
2023-11-01historical
-
2023-07-31$6,300,000 Active
-
2022-05-09historical
-
2022-04-11historical Under Contract Accepting Backups
-
2022-03-21$6,900,000 Active
-
2019-04-30soldstatus $2,600,000
-
2013-04-25soldstatus $1,420,000
-
2012-07-26soldstatus $670,000
-
2011-07-26soldstatus $670,000
-
2010-12-13soldstatus $1,043,044
-
2010-12-13soldstatus $1,043,044
-
2006-03-01soldstatus $1,600,000
-
2003-08-04soldstatus $1,105,000
-
1991-08-30soldstatus $115,000
-
1991-08-30soldstatus $115,000
ⓘ Source: listings_history table (triggers on properties + properties_extension) + one-shot
backfill from property_details.listing_events for pre-trigger history.
Climate risk First Street
- Flood 1/10 Low FEMA zone X (shaded) · 0% chance over 30 yrs
- Wildfire 1/10 Low
- Heat 9/10 Extreme 6 d/yr ≥112°F today · 17 d/yr by 30 yrs out
- Wind 1/10 Low
- Air quality 3/10 Moderate 3 unhealthy d/yr today · 3 by 30 yrs out
Nearby sold comps map
Loading sold comps map…
Walkable amenities ~0.75 mi
Loading nearby amenities…
Taxation est. · year 1
- Rental income
- $445,560
- − Mortgage interest
- −$249,269
- − Property taxes
- −$66,750
- − Insurance
- −$22,250
- − Repairs & maintenance
- −$35,645
- − Management
- −$35,645
- − Depreciation
- −$129,455
- Taxable loss
- −$93,453
- Est. tax savings @ 24.0%
- +$22,429
- After-tax cash flow
- $5,386/yr
For passive investors: Depreciation is non-cash, so a rental often shows a tax loss while cash-flowing — sheltering income. Rental losses are passive: they offset passive income freely, and up to $25,000/yr can offset ordinary (W-2) income if you actively participate and your MAGI is under $100k (phasing out to $0 by $150k); unused losses carry forward. On sale, claimed depreciation is recaptured at up to 25%, and gains may owe capital-gains tax (a 1031 exchange can defer both). Figures are a year-1 estimate at your 24.0% rate — not tax advice; consult a CPA.
Schools (NCES district)
- District
- Phoenix Union High School District (4286)
- NCES district ID
- 0406330
- Math proficiency
- 10% ▼ -27.00%
- Reading proficiency
- 15% ▼ -18.00%
- Median HH income
- $39,055
- Composite
- 10.63/100
- National rank
- #9773
- State rank
- #224 of 249 in AZ
Livability — Phoenix
- Score
- 75/100
- State rank
- #16
- US rank
- #3924
Category grades
Schools grade is shown separately in the Schools card above.
Census & demographics
- Census place
- Phoenix, AZ
- County
- Maricopa County · 4,537,380 people
- City population
- 1,500,198
- Metro
- Phoenix-Mesa-Chandler, AZ
- Population (ZIP)
- 41,490
- Household income
- $54,874
- Rent vs Own
- Severe rent burden
- 3390.0
Population outlook (Maricopa County) Hauer SSP2
- Today (2025)
- 4,979,203 people
- By 2030
- 5,378,229 · +8.0%
- By 2040
- 6,156,598 · +23.6%
- By 2050
- 6,872,376 · +38.0%
- By 2075
- 8,401,270 · +68.7%
- By 2100
- 9,247,439 · +85.7%
Race, ethnicity, and origin ACS 2023
- Neighborhood character
- Diverse neighborhood (Simpson 0.63)
- Race & ethnicity
- Hispanic / Latino 54% Two or more races 29% White 23% Black 12% Asian 3% Native American 2%
- Hispanic origin (detail)
- Mexican 44%
- Common ancestry
- Italian 1% Scotch-Irish 1% Slovak 1%
- Foreign-born
- 26% · Canada, India, Vietnam
- Languages at home
- 51% English-only · Spanish 40% Other Indo-European 2% French/Haitian/Cajun 1%
Political lean MEDSL · Maricopa
- 2024 margin
- Toss-up / Even · D 47.7% · R 51.2% · Other 1.1%
- 2008→2024 swing
- +7.1pp toward D · 2008: -10.6pp · 2024: -3.5pp
- All cycles
- 2024: R+3.5 2020: D+2.2 2016: R+3.5 2012: R+12.0 2008: R+10.6
Not yet ingested
- Civics
- —
Market trends
- HPI YoY
- ▼ -80.80%
- Current HPI
- 446.4613
- Rent YoY
- ▼ -3.74%
- Metro
- Phoenix-Mesa-Chandler, AZ
- State GDP YoY
- ▲ 4.54%
- F500 in state
- 20
Industry mix (Fortune 500 HQ in AZ)
| Industry | F500 HQs | Revenue |
|---|---|---|
| Technology | 2 | $13B |
|
||
| Mining / Metals | 1 | $23B |
|
||
| Environmental Services | 1 | $16B |
|
||
| Metals / Steel | 1 | $14B |
|
||
| Technology Distribution | 1 | $9B |
|
||
| Homebuilding | 1 | $8B |
|
||
Price history
+3769.6% since first listed16 events — show timeline
- 2026-05-26 Listed $4,450,000 ARMLS
- 2023-11-01 Listing Removed — ARMLS
- 2023-07-31 Listed $6,300,000 ARMLS
- 2022-05-09 Listing Removed — ARMLS
- 2022-04-11 Contingent — ARMLS
- 2022-03-21 Listed $6,900,000 ARMLS
- 2019-04-30 Sold (Public Records) $2,600,000 Public Records
- 2013-04-25 Sold (Public Records) $1,420,000 Public Records
- 2012-07-26 Sold (Public Records) $670,000 Public Records
- 2011-07-26 Sold (Public Records) $670,000 Public Records
- 2010-12-13 Sold (Public Records) $1,043,044 Public Records
- 2010-12-13 Sold (Public Records) $1,043,044 Public Records
- 2006-03-01 Sold (Public Records) $1,600,000 Public Records
- 2003-08-04 Sold (Public Records) $1,105,000 Public Records
- 1991-08-30 Sold (Public Records) $115,000 Public Records
- 1991-08-30 Sold (Public Records) $115,000 Public Records
Property tax history
+0.3%/yrLatest (2025): $4,064 · +3.5% YoY. Source: county tax records.
Cash-flow waterfall
monthlySold comps — $/sqft
last 12 mo · ≤1 miLoading sold comps…