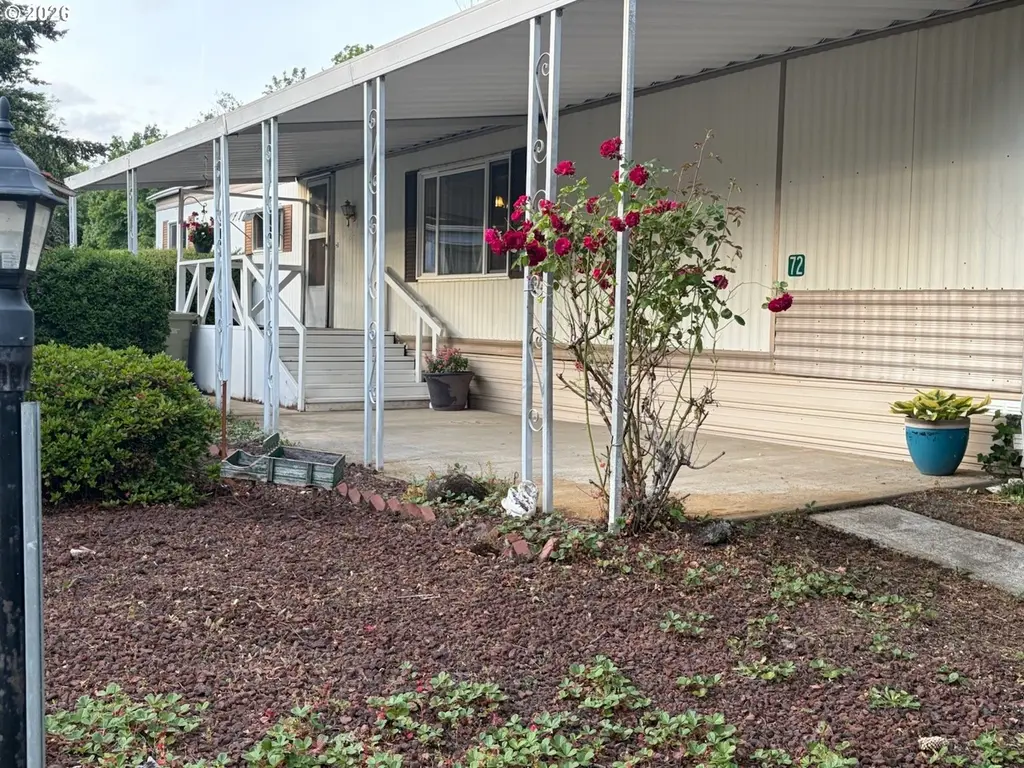
570 N 10th Ave #72
Cornelius, OR 97113
$39,900B+
2 bd · 1.0 ba ·
840 sqft ·
Built 1971
· Manufactured
· Active
· 28 DOM
Cashflow @ list (25.0% down · 7.5%)
Estimated rent
$1,588/mo
Mortgage (P&I)
−$209
Tax + insurance
−$66
HOA
−$0
Vac / Maint / Mgmt
−$333
Net cashflow
$978/mo
Annual
$11,741/yr
Cap rate
35.72%
Cash-on-cash
105.09%
DSCR
5.68
1% rule
3.98%
Cash to close
$11,172
Investor read
- This is a 2-bed/1.0-bath manufactured listed at $40k.
- At list price, monthly cash flow is $978 ($12k/yr) — positive.
- The deal already cash-flows at list — no discount required.
- Meets the 1% rule at list price ($2k rent vs $40k).
- It's been on market 28 days — a 2% lower offer ($39k) is reasonable based on typical stale-listing flexibility.
- Recommended offer: $39k (1.5% below list) — sets the bar for market timing.
- Local home prices are declining (-3.0%/yr); year-one equity from $276 of loan paydown is wiped out by about $1k of value loss. Plan a longer hold.
- Location reads 82/100 on livability (#47 in OR, #1,193 nationally) — a professional / high-income tenant draw. Strengths: commute A+, employment A+, housing A+; Watch: amenities C-, cost of living C-.
- Forest Grove SD 15 (suburban): math 32% / reading 46% proficiency, ranked #111 of 183 in OR (top 61%) — families likely to look elsewhere, expect single-tenant / working-renter base with shorter leases.
- Zoned schools: Echo Shaw Elementary School (377 students, 72% FRL); Neil Armstrong Middle School (math 24% / reading 75%, grade C, #26 of 128 statewide, top 21%, 826 students, 48% FRL); Forest Grove High School (1,977 students, 41% FRL) — zoned schools at 54% FRL track the district average.
- Market conditions: 113 active listings in the ZIP; 26 comparable units currently listed for rent nearby; rentals at typical pace (median 18d on market — plan ~3-4 weeks tenant-placement turnaround); 2,224 units permitted in Washington County in 2024 (242 in 5+ unit buildings).
- Washington County population projected at +33% by 2050 — long-run rental-demand tailwind backs the buy-and-hold thesis.
- Current owner paid $10k; list at $40k implies a 299% gain — meaningful room to come down on a strong offer.
- At projected returns (-3.0% appreciation + 3.0% rent growth), your $11k cash investment doubles in ~2 years — after that, you're playing with house money.
- Cap rate 35.7% vs local median 2.9% in Cornelius — top-decile yield for the area; either an underpriced asset or a hidden risk that comps aren't pricing in. Stress-test before assuming the spread holds.
Questions for listing agent
- Built in 1971 — when were the roof, HVAC, electrical panel, plumbing, and water heater last replaced?
- Is there a deadline driving the sale (1031 exchange, divorce, estate, relocation)? That informs how much negotiation room exists.
- Schools are F-rated, which usually means shorter tenancies and higher turnover. Who's the typical renter profile here, and what's been the actual vacancy rate?
- What's the average days-on-market for RENTAL listings here right now (not sales)? A rising rental-DOM trend means longer vacancies and softer asking-rent achievability than the comps imply.
- What's the recent tenant-quality profile in this submarket — average credit score on applications, eviction rate, late-payment / NSF rate, and stable-employment percentage? A property-management company in the area should have these aggregated.
- How much new for-sale + rental construction is in the pipeline within 1–3 miles? Heavy new supply typically softens prices + rents 12–24 months out; constrained supply supports both.
CashFlowRE · CFR-Q8K2134V685D56
· Data 2 days ago
cashflowre.app · 2026-05-29