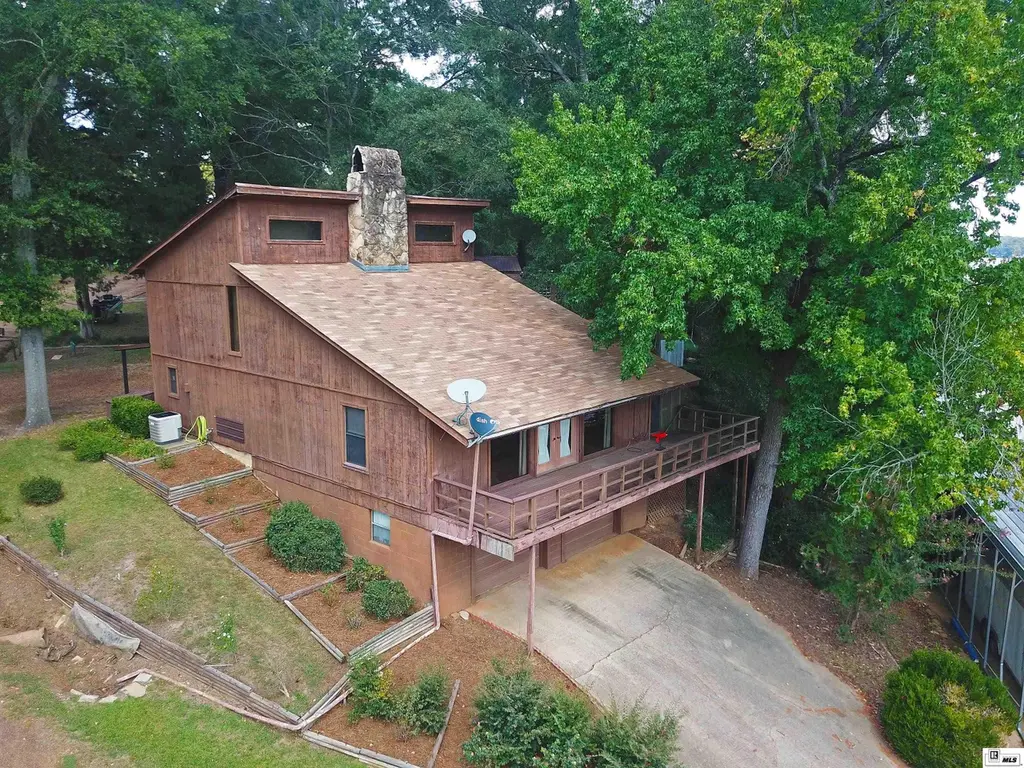
147 Circle Dr
Farmerville, LA 71241
$225,000D+
2 bd · 2.0 ba ·
1,350 sqft ·
Built 1981
· SingleFamily
· Pending
· 259 DOM
Cashflow @ list (25.0% down · 7.5%)
Estimated rent
$2,048/mo
Mortgage (P&I)
−$1,180
Tax + insurance
−$147
HOA
−$0
Vac / Maint / Mgmt
−$430
Net cashflow
$291/mo
Annual
$3,489/yr
Cap rate
7.84%
Cash-on-cash
5.54%
DSCR
1.25
1% rule
0.91%
Cash to close
$63,000
Investor read
- This is a 2-bed/2.0-bath single-family listed at $225k.
- At list price, monthly cash flow is $291 ($3k/yr) — positive.
- The deal already cash-flows at list — no discount required.
- To meet the 1% rule (rent ≥ 1% of price), the offer needs to be $205k (9.0% below list).
- It's been on market 259 days — a 12% lower offer ($198k) is reasonable based on typical stale-listing flexibility.
- Recommended offer: $198k (12.0% below list) — sets the bar for market timing.
- Local home prices are declining (-3.0%/yr); year-one equity from $2k of loan paydown is wiped out by about $7k of value loss. Plan a longer hold.
- Location reads 57/100 on livability (#321 in LA) — a working-class tenant base; expect higher turnover. Strengths: cost of living A+, housing A+; Watch: health & safety D, crime F, amenities F.
- Union Parish (rural): math 12% / reading 20% proficiency, ranked #74 of 98 in LA (top 76%) — low school quality limits family demand, transient renter base, plan for 1-2y turnover; 76% free/reduced lunch — lower-income household profile, screen leases tightly.
- Zoned schools: Union Parish Elementary School (math 4% / reading 8%, grade F, #630 of 646 statewide, top 98%, 659 students, 58% FRL); Union Parish High School (math 8% / reading 16%, grade F, #235 of 265 statewide, top 90%, 745 students, 52% FRL) — zoned schools average 55% FRL vs 76% district-wide (21 pts lower); this property's tenant base skews higher-income than the district average.
- Market conditions: 111 active listings in the ZIP; 2 units permitted in Union Parish in 2024 (0 in 5+ unit buildings).
- Union County population projected at -14% by 2050 — secular population decline; favor cash flow + early exit over multi-decade hold.
- Cap rate 7.8% vs local median 5.4% in Farmerville — top-decile yield for the area; either an underpriced asset or a hidden risk that comps aren't pricing in. Stress-test before assuming the spread holds.
Questions for listing agent
- It's been on market 259 days. Have you received any prior offers? Is the seller open to a 12% concession, seller financing, or rate buy-down credit?
- Why hasn't it sold? Are there any deal-killer items the seller is aware of (foundation, flood, title, zoning, code violations)?
- Is there a deadline driving the sale (1031 exchange, divorce, estate, relocation)? That informs how much negotiation room exists.
- Crime grade is F in this area — have there been break-ins, vandalism, or insurance claims at this property in the last 3 years? What carrier currently insures it and at what premium?
- The area grade is low — what's the realistic commute time and amenity access for the typical tenant pool here? Any planned neighborhood developments (good or bad) we should know about?
- What's the average days-on-market for RENTAL listings here right now (not sales)? A rising rental-DOM trend means longer vacancies and softer asking-rent achievability than the comps imply.
- What's the recent tenant-quality profile in this submarket — average credit score on applications, eviction rate, late-payment / NSF rate, and stable-employment percentage? A property-management company in the area should have these aggregated.
- How much new for-sale + rental construction is in the pipeline within 1–3 miles? Heavy new supply typically softens prices + rents 12–24 months out; constrained supply supports both.
CashFlowRE · CFR-Q9VV0XC1TS6ZNG
· Data 6 days ago
cashflowre.app · 2026-05-29