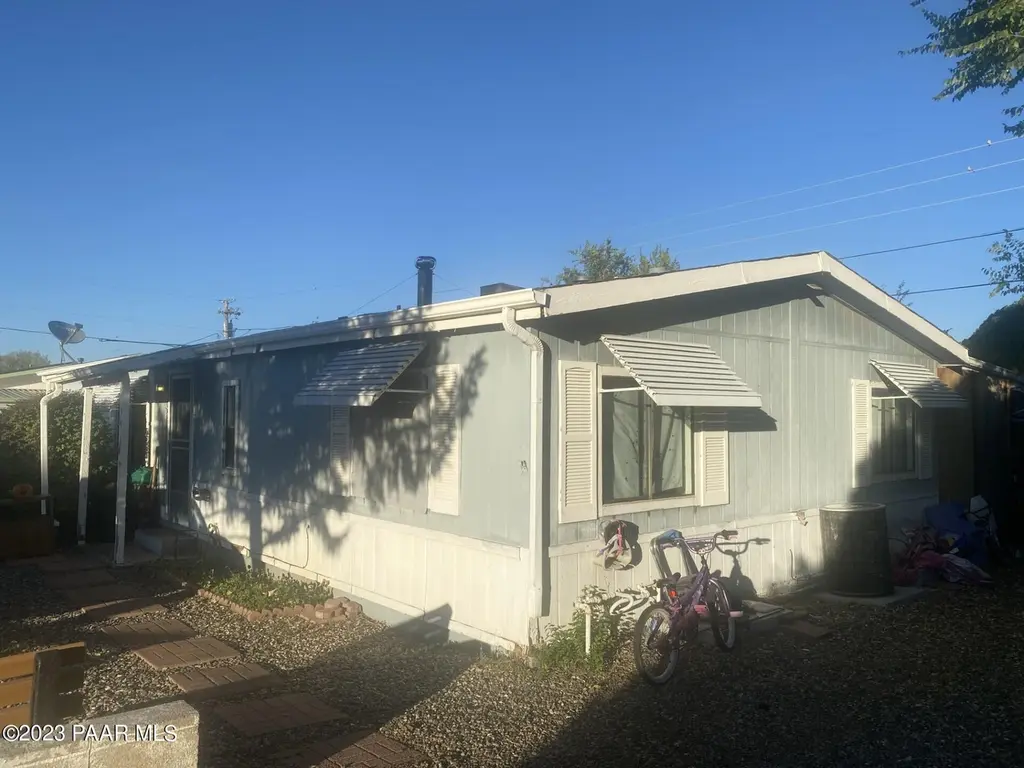
4581 N Ranger Rd
Prescott Valley, AZ 86314
$195,000C
3 bd · 2.0 ba ·
1,344 sqft ·
Built 1986
· Manufactured
· Active
· 738 DOM
Cashflow @ list (25.0% down · 7.5%)
Estimated rent
$1,845/mo
Mortgage (P&I)
−$1,023
Tax + insurance
−$122
HOA
−$0
Vac / Maint / Mgmt
−$388
Net cashflow
$314/mo
Annual
$3,763/yr
Cap rate
8.22%
Cash-on-cash
6.89%
DSCR
1.31
1% rule
0.95%
Cash to close
$54,600
Investor read
- This is a 3-bed/2.0-bath manufactured listed at $195k.
- At list price, monthly cash flow is $314 ($4k/yr) — positive.
- The deal already cash-flows at list — no discount required.
- To meet the 1% rule (rent ≥ 1% of price), the offer needs to be $185k (5.4% below list).
- It's been on market 738 days — a 12% lower offer ($172k) is reasonable based on typical stale-listing flexibility.
- Recommended offer: $172k (12.0% below list) — sets the bar for market timing.
- Local home prices are declining (-3.0%/yr); year-one equity from $1k of loan paydown is wiped out by about $6k of value loss. Plan a longer hold.
- Location reads 62/100 on livability (#126 in AZ) — a middle-class / working-renter tenant base. Strengths: housing A+, crime A-; Watch: schools C-, amenities F, commute F.
- Humboldt Unified District (4469) (suburban): math 31% / reading 37% proficiency, ranked #94 of 249 in AZ (top 38%) — families likely to look elsewhere, expect single-tenant / working-renter base with shorter leases.
- Market conditions: Rents flat; 447 active listings in the ZIP; 38 comparable units currently listed for rent nearby; rentals lingering (median 44d on market — plan ~5-8 weeks vacancy on turnover, expect pricing pressure); 53% of comp listings sitting > 30 days — soft ceiling on asking rent; 2,062 units permitted in Yavapai County in 2024 (98 in 5+ unit buildings).
- Yavapai County population projected at +10% by 2050 — modest demand growth; plan on rents tracking national, not racing it.
- 5 sale attempts since 3y ago; this cycle's ask has dropped $45k (19%) from the opening price — seller is motivated, your offer sets the floor, not the list.
- Current owner paid $78k; list at $195k implies a 150% gain — meaningful room to come down on a strong offer.
- Climate carrying-cost: moderate wildfire risk — expect insurance premiums to compound above CPI over the hold.
- Cap rate 8.2% vs local median 3.2% in Prescott Valley — top-decile yield for the area; either an underpriced asset or a hidden risk that comps aren't pricing in. Stress-test before assuming the spread holds.
- This rent runs 32% of the median local income ($69k/yr) — at the standard rent-burdened threshold; future hikes will face affordability resistance.
Questions for listing agent
- It's been on market 738 days. Have you received any prior offers? Is the seller open to a 12% concession, seller financing, or rate buy-down credit?
- Why hasn't it sold? Are there any deal-killer items the seller is aware of (foundation, flood, title, zoning, code violations)?
- Is there a deadline driving the sale (1031 exchange, divorce, estate, relocation)? That informs how much negotiation room exists.
- What's the average days-on-market for RENTAL listings here right now (not sales)? A rising rental-DOM trend means longer vacancies and softer asking-rent achievability than the comps imply.
- What's the recent tenant-quality profile in this submarket — average credit score on applications, eviction rate, late-payment / NSF rate, and stable-employment percentage? A property-management company in the area should have these aggregated.
- How much new for-sale + rental construction is in the pipeline within 1–3 miles? Heavy new supply typically softens prices + rents 12–24 months out; constrained supply supports both.
CashFlowRE · CFR-QAFW4P2G0629V3
· Data 2 days ago
cashflowre.app · 2026-05-29