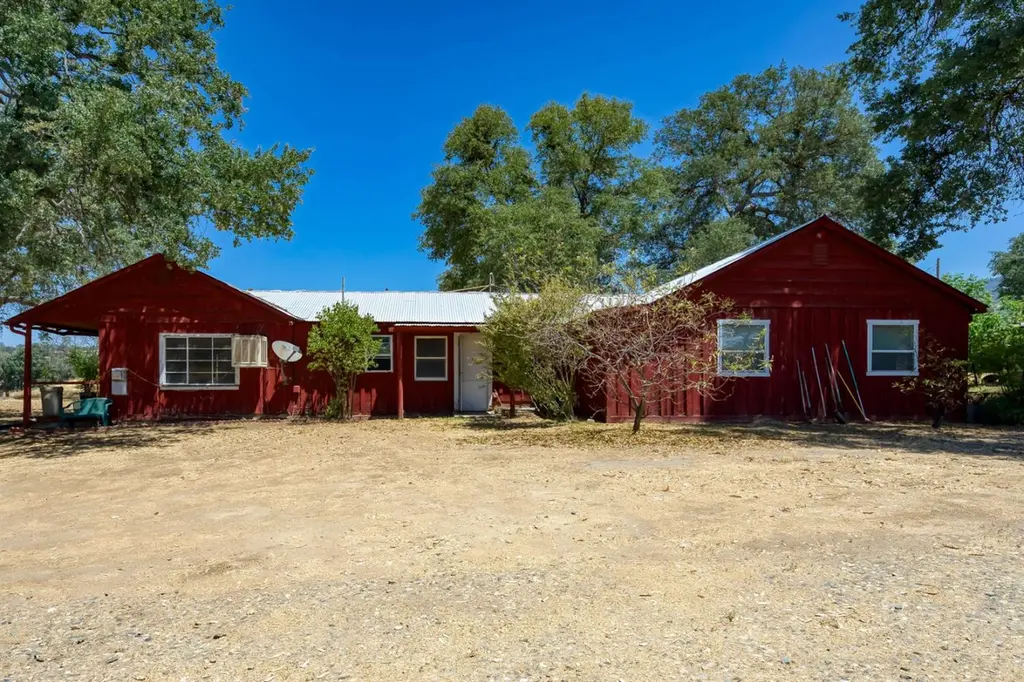
31913 Auberry Rd
Auberry, CA 93602
$325,000D+
4 bd · 2.0 ba ·
1,432 sqft ·
Built 1979
· SingleFamily
· Active
· 19 DOM
Cashflow @ list (25.0% down · 7.5%)
Estimated rent
$2,586/mo
Mortgage (P&I)
−$1,704
Tax + insurance
−$194
HOA
−$0
Vac / Maint / Mgmt
−$543
Net cashflow
$145/mo
Annual
$1,735/yr
Cap rate
6.83%
Cash-on-cash
1.91%
DSCR
1.08
1% rule
0.80%
Cash to close
$91,000
Investor read
- This is a 4-bed/2.0-bath single-family listed at $325k.
- At list price, monthly cash flow is $145 ($2k/yr) — positive.
- The deal already cash-flows at list — no discount required.
- To meet the 1% rule (rent ≥ 1% of price), the offer needs to be $259k (20.4% below list).
- It's been on market 19 days — a 2% lower offer ($320k) is reasonable based on typical stale-listing flexibility.
- Recommended offer: $259k (20.4% below list) — sets the bar for 1% rule.
- Local home prices are declining (-3.0%/yr); year-one equity from $2k of loan paydown is wiped out by about $10k of value loss. Plan a longer hold.
- Location reads 53/100 on livability (#982 in CA) — a working-class tenant base; expect higher turnover. Strengths: housing A+, crime B, employment B; Watch: amenities F, commute F, cost of living F.
- Sierra Unified (rural): math 31% / reading 51% proficiency, ranked #212 of 517 in CA (top 41%) — families likely to look elsewhere, expect single-tenant / working-renter base with shorter leases.
- Zoned schools: Foothill Elementary (math 37% / reading 48%, grade F, #552 of 1,571 statewide, top 35%, 660 students, 47% FRL); Sierra Junior High (math 32% / reading 57%, grade D, #130 of 498 statewide, top 27%, 185 students, 36% FRL); Sierra High (math 17% / reading 57%, grade F, #578 of 1,170 statewide, top 51%, 399 students, 32% FRL) — zoned schools at 38% FRL track the district average.
- Market conditions: 59 active listings in the ZIP; 2,426 units permitted in Fresno County in 2024 (296 in 5+ unit buildings).
- Fresno County population projected at +11% by 2050 — modest demand growth; plan on rents tracking national, not racing it.
- Climate carrying-cost: severe wildfire risk; extreme-heat days projected 7→17/yr by 2055 (HVAC capex compounding) — expect insurance premiums to compound above CPI over the hold.
- Cap rate 6.8% vs local median 2.4% in Auberry — top-decile yield for the area; either an underpriced asset or a hidden risk that comps aren't pricing in. Stress-test before assuming the spread holds.
Questions for listing agent
- Built in 1979 — when were the roof, HVAC, electrical panel, plumbing, and water heater last replaced?
- Is there a deadline driving the sale (1031 exchange, divorce, estate, relocation)? That informs how much negotiation room exists.
- Schools are D-rated, which usually means shorter tenancies and higher turnover. Who's the typical renter profile here, and what's been the actual vacancy rate?
- The area grade is low — what's the realistic commute time and amenity access for the typical tenant pool here? Any planned neighborhood developments (good or bad) we should know about?
- What's the average days-on-market for RENTAL listings here right now (not sales)? A rising rental-DOM trend means longer vacancies and softer asking-rent achievability than the comps imply.
- What's the recent tenant-quality profile in this submarket — average credit score on applications, eviction rate, late-payment / NSF rate, and stable-employment percentage? A property-management company in the area should have these aggregated.
- How much new for-sale + rental construction is in the pipeline within 1–3 miles? Heavy new supply typically softens prices + rents 12–24 months out; constrained supply supports both.
CashFlowRE · CFR-QB6HYREY3G832G
· Data 1 day ago
cashflowre.app · 2026-05-29