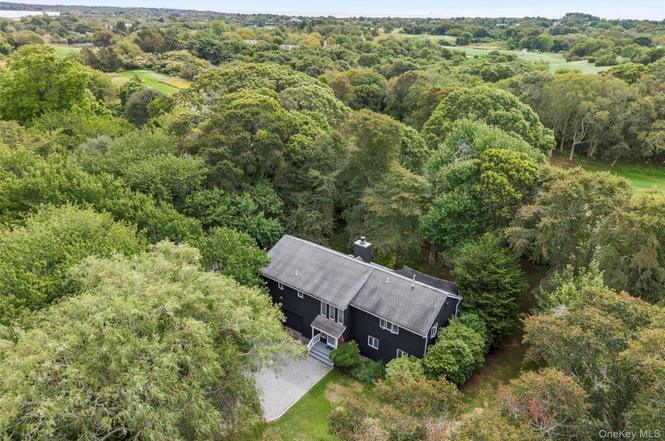
126 Fairview Ave
Montauk, NY 11954
$1,935,000C+
3 bd · 2.5 ba ·
2,136 sqft ·
Built 1986
· SingleFamily
· Pending
· 61 DOM
Cashflow @ list (25.0% down · 7.5%)
Estimated rent
$18,507/mo
Mortgage (P&I)
−$10,147
Tax + insurance
−$1,397
HOA
−$0
Vac / Maint / Mgmt
−$3,887
Net cashflow
$3,077/mo
Annual
$36,919/yr
Cap rate
8.20%
Cash-on-cash
6.81%
DSCR
1.30
1% rule
0.96%
Cash to close
$541,800
Investor read
- This is a 3-bed/2.5-bath single-family listed at $1.94M.
- At list price, monthly cash flow is $3k ($37k/yr) — positive.
- The deal already cash-flows at list — no discount required.
- To meet the 1% rule (rent ≥ 1% of price), the offer needs to be $1.85M (4.4% below list).
- It's been on market 61 days — a 6% lower offer ($1.82M) is reasonable based on typical stale-listing flexibility.
- Recommended offer: $1.82M (6.0% below list) — sets the bar for market timing.
- Local home prices are declining (-1.8%/yr); year-one equity from $13k of loan paydown is wiped out by about $34k of value loss. Plan a longer hold.
- Location reads 69/100 on livability (#474 in NY) — a middle-class / working-renter tenant base. Strengths: crime A+, employment A+, health & safety A; Watch: housing C-, amenities F, commute F.
- Montauk Union Free School District (town): math 50% / reading 60% proficiency, ranked #311 of 755 in NY (top 41%) — acceptable for families but not a draw, mixed tenant base, ~2y average lease.
- Zoned schools: Montauk School (math 62% / reading 82%, grade A-, #378 of 2,108 statewide, top 20%, 303 students, 0% FRL) — zoned schools average 0% FRL vs 21% district-wide (21 pts lower); this property's tenant base skews higher-income than the district average.
- Zoned-school proficiency averages 72% at this address vs 55% district-wide (+17 pts) — the actual schools serving this property are materially stronger than the Montauk Union Free School District average implies; a family-tenant draw the district grade alone would hide.
- Market conditions: 39 active listings in the ZIP; 1 comparable units currently listed for rent nearby; high-income renter base; 1,366 units permitted in Suffolk County in 2024 (216 in 5+ unit buildings).
- Suffolk County population projected to shrink 5% by 2050 — rents likely to lag national; underwrite the cash flow, not the appreciation.
- 3 sale attempts since 2y ago with the ask held roughly flat each time — persistent listings suggest the price (not the market) is what's stuck; bring a comps-based counter.
- Current owner paid $270k; list at $1.94M implies a 617% gain — meaningful room to come down on a strong offer.
- Climate carrying-cost: severe wind risk, 80% chance of damaging wind over 30y — expect insurance premiums to compound above CPI over the hold.
- At $18,507/mo this rent would consume 155% of the median local household income ($143k/yr) (locally 20% of renters already pay >50% of income on rent) — very limited rent-growth headroom before tenants either downsize or default.
Questions for listing agent
- It's been on market 61 days. Have you received any prior offers? Is the seller open to a 6% concession, seller financing, or rate buy-down credit?
- Why hasn't it sold? Are there any deal-killer items the seller is aware of (foundation, flood, title, zoning, code violations)?
- Is there a deadline driving the sale (1031 exchange, divorce, estate, relocation)? That informs how much negotiation room exists.
- What's the average days-on-market for RENTAL listings here right now (not sales)? A rising rental-DOM trend means longer vacancies and softer asking-rent achievability than the comps imply.
- What's the recent tenant-quality profile in this submarket — average credit score on applications, eviction rate, late-payment / NSF rate, and stable-employment percentage? A property-management company in the area should have these aggregated.
- How much new for-sale + rental construction is in the pipeline within 1–3 miles? Heavy new supply typically softens prices + rents 12–24 months out; constrained supply supports both.
CashFlowRE · CFR-QB9KDZFWWGVCFA
· Data 3 weeks ago
cashflowre.app · 2026-05-29