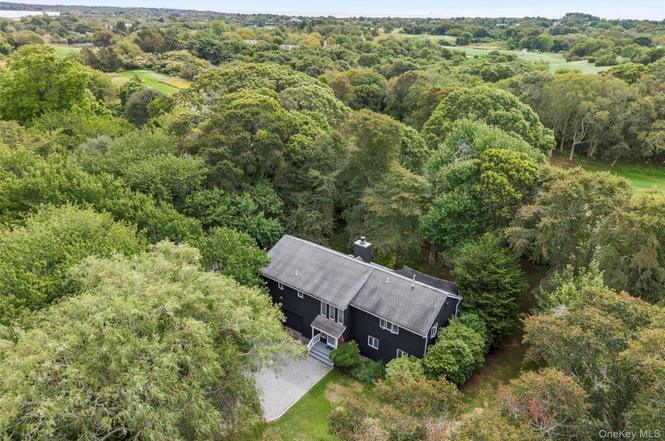
126 Fairview Ave · Montauk, NY
Flood risk 1/10 · Minimal
- FEMA flood zone
- X (unshaded)
- Chance of flooding over 30 yrs
- 0.0%
- Est. flood insurance / yr
- $473 – $860
Fire risk 2/10 · Minimal
- Est. fire insurance / yr
- $691 – $1,283
Heat risk 4/10 · Minor
- Hot days now (above 88°F)
- 7 days/yr
- Hot days in 30 yrs
- 20 days/yr
Wind risk 8/10 · Major
- Chance of severe wind over 30 yrs
- 80.0%
Air-quality risk 3/10 · Minor
- Unhealthy air days now
- 2 days/yr
- Unhealthy air days in 30 yrs
- 3 days/yr
Risk factors via First Street. Map © Google.
Why this score? — see what drove the C+ grade
The composite is a weighted blend of 9 inputs, each scored 0–100. Each bar is that input's sub-score; the figure is the points it added to the 100-point composite (weight × sub-score).
- Cash flow +22.0/30.0
- ARV discount +11.9/15.0
- DSCR +7.0/10.0
- Schools +5.1/10.0
- 1% rule +4.6/10.0
- Appreciation +4.1/10.0
- Livability +3.5/5.0
- Rent growth +2.5/5.0
- Condition / age +2.5/5.0
$1,935,000
🖨 Deal sheet 📄 Offer letter ✓ Due diligence
Listing remarks
This turnkey Montauk spot sits right up against the 6th fairway at Montauk Downs State Park Golf Course, giving you those clean, open views of the course every day. It’s in a prime position for the active Hamptons life—quick drive to Ditch Plains for surfing, Montauk Harbor for fishing or boating, plus easy access to the beaches and the downtown scene. The elevated deck out back is the real winner: perfect for morning coffee watching the sunrise, grilling with friends, or just kicking back as the sun sets over the fairway. Plenty of space to unwind without feeling crowded. Inside, it’s a comfortable 3-bedroom, 2.5-bath setup that’s ready to move into—no project
Key facts
- Elevated deck
- Primary suite
- Gourmet kitchen
Tags
Neighborhood map
What this means for you Summary
Snapshot
- This is a 3-bed/2.5-bath single-family listed at $1.94M.
Deal economics
- At list price, monthly cash flow is $3k ($37k/yr) — positive.
- The deal already cash-flows at list — no discount required.
- To meet the 1% rule (rent ≥ 1% of price), the offer needs to be $1.85M (4.4% below list).
- Recommended offer: $1.82M (6.0% below list) — sets the bar for market timing.
Location & tenants
- Location reads 69/100 on livability (#474 in NY) — a middle-class / working-renter tenant base. Strengths: crime A+, employment A+, health & safety A; Watch: housing C-, amenities F, commute F.
- Montauk Union Free School District (town): math 50% / reading 60% proficiency, ranked #311 of 755 in NY (top 41%) — acceptable for families but not a draw, mixed tenant base, ~2y average lease.
- Zoned schools: Montauk School (math 62% / reading 82%, grade A-, #378 of 2,108 statewide, top 20%, 303 students, 0% FRL) — zoned schools average 0% FRL vs 21% district-wide (21 pts lower); this property's tenant base skews higher-income than the district average.
- Zoned-school proficiency averages 72% at this address vs 55% district-wide (+17 pts) — the actual schools serving this property are materially stronger than the Montauk Union Free School District average implies; a family-tenant draw the district grade alone would hide.
- Market conditions: 39 active listings in the ZIP; 1 comparable units currently listed for rent nearby; high-income renter base; 1,366 units permitted in Suffolk County in 2024 (216 in 5+ unit buildings).
- At $18,507/mo this rent would consume 155% of the median local household income ($143k/yr) (locally 20% of renters already pay >50% of income on rent) — very limited rent-growth headroom before tenants either downsize or default.
Forward outlook
- Local home prices are declining (-1.8%/yr); year-one equity from $13k of loan paydown is wiped out by about $34k of value loss. Plan a longer hold.
- Suffolk County population projected to shrink 5% by 2050 — rents likely to lag national; underwrite the cash flow, not the appreciation.
Negotiation context
- It's been on market 61 days — a 6% lower offer ($1.82M) is reasonable based on typical stale-listing flexibility.
- 3 sale attempts since 2y ago with the ask held roughly flat each time — persistent listings suggest the price (not the market) is what's stuck; bring a comps-based counter.
- Current owner paid $270k; list at $1.94M implies a 617% gain — meaningful room to come down on a strong offer.
Risks & watch-outs
- Climate carrying-cost: severe wind risk, 80% chance of damaging wind over 30y — expect insurance premiums to compound above CPI over the hold.
Questions for the listing agent
- It's been on market 61 days. Have you received any prior offers? Is the seller open to a 6% concession, seller financing, or rate buy-down credit?
- Why hasn't it sold? Are there any deal-killer items the seller is aware of (foundation, flood, title, zoning, code violations)?
- Is there a deadline driving the sale (1031 exchange, divorce, estate, relocation)? That informs how much negotiation room exists.
- What's the average days-on-market for RENTAL listings here right now (not sales)? A rising rental-DOM trend means longer vacancies and softer asking-rent achievability than the comps imply.
- What's the recent tenant-quality profile in this submarket — average credit score on applications, eviction rate, late-payment / NSF rate, and stable-employment percentage? A property-management company in the area should have these aggregated.
- How much new for-sale + rental construction is in the pipeline within 1–3 miles? Heavy new supply typically softens prices + rents 12–24 months out; constrained supply supports both.
Investment metrics
- 1% rule
- 0.96% ✗
- Cap rate
- 8.20%
- Cash-on-cash
- 6.81%
- DSCR
- 1.30
- GRM
- 8.7
CMA / ARV
- ARV (on-the-fly)
- $2,142,408
- Comps found
- 2
Show comp detail 2 sales within ~0.75 mi
| Address | Dist | Beds/Ba | Sqft | Sold | Price | $/sf | Match |
|---|---|---|---|---|---|---|---|
| 126 Fairview Ave | 0.00mi | 3/2.5 | 2,136 (0%) | 1mo | $1,867,500 | $874 | 100 |
| 123 Fairview Ave | 0.04mi | 3/2.0 | 1,845 (-14%) | 8mo | $1,850,000 | $1,003 | 66 |
Match score weights: distance 35% · size 25% · config 20% · recency 20%. Top-matched comps best support the ARV.
Projected returns pro-forma
-1.78% appreciation · 3.0% rent growth · sell at horizon
- IRR
- -0.8%
- Equity multiple
- 0.97×
- Total profit
- $-17,856
- Equity at exit
- $395,528
- IRR
- 6.8%
- Equity multiple
- 1.60×
- Total profit
- $324,071
- Equity at exit
- $357,014
Cash invested: $541,800 (down + closing). Projections, not guarantees.
Landlord ↔ Tenant lean methodology
- Overall (STATE)
- 15 Strongly Tenant-Friendly
- State New York
- 15 Strongly Tenant-Friendly · D+10
- County
- — inherits STATE
- City
- — inherits STATE
ZIP-level market 11954
- Home prices YoY
- -0.3%
- Active inventory
- 39
- Price-to-rent
- 8.7×
Monthly cashflow live
- Estimated rent
- $18,507 medium interval (Pro) →
- Mortgage (P&I)
- −$10,147
- Tax from tax record
- −$591 /mo · $7,087/yr
- Insurance
- −$806
- HOA
- −$0
- Vacancy / Maint / Mgmt
- −$3,887
- Net cashflow
- $3,077
Break-even live
UW: 25.0% down · 7.5% · 30yr · 1.5% tax · 5.0% vac · 8.0% maint · 8.0% mgmt
Financing live
Cash to close
- Down payment
- $483,750
- Closing costs
- $58,050
- Reserves months
- —
- Total cash needed
- —
Loan-product check · same deal, 3 products live
Conventional
25% down · 7.5% · 30yr
- Down + closing
- —
- Monthly P&I
- —
- Monthly cashflow
- —
- DSCR
- —
- Eligible?
- —
Personal DTI + credit; lowest rate.
DSCR
20% down · 8.5% · 30yr
- Down + closing
- —
- Monthly P&I
- —
- Monthly cashflow
- —
- DSCR
- —
- Eligible?
- —
No personal income docs; deal must DSCR.
Hard money
10% down · 12.0% · 12mo
- Down + closing
- —
- Monthly P&I
- —
- Monthly cashflow
- —
- DSCR
- —
- Eligible?
- —
Short-term bridge; refi at stabilization.
Rent comps 1 comps
| Address | Beds | Baths | Sqft | Rent | $/sqft | DOM | Units | Dist |
|---|---|---|---|---|---|---|---|---|
| 154 W Lake Dr Montauk, NY | 4.0 | 2.5 | 2800 | $30,000 | $10.71 | 18d | 1 | 0.84mi |
Listing history 8 events
-
2026-03-24status Pending
-
2026-01-22$1,935,000 Active
-
2024-08-08historical
-
2024-05-01historical
-
2024-05-01$1,950,000 Active
-
2024-05-01$1,950,000 Active
-
2022-11-30historical
-
1999-07-14soldstatus $270,000
ⓘ Source: listings_history table (triggers on properties + properties_extension) + one-shot
backfill from property_details.listing_events for pre-trigger history.
Tax reassessment forecast NY · Partial reset (capped growth)
- Current annual tax
- $7,087 · $591/mo
- Projected year-2 tax
- $19,894 · $1,658/mo
- Expected delta
- +$12,807/yr (+$1,067/mo · 180.7%)
ⓘ Screening estimate from a state-policy table — verify with the county assessor before closing.
Climate risk First Street
- Flood 1/10 Low FEMA zone X (unshaded) · 0% chance over 30 yrs
- Wildfire 2/10 Low
- Heat 4/10 Moderate 7 d/yr ≥88°F today · 20 d/yr by 30 yrs out
- Wind 8/10 Severe 80% chance of damaging wind over 30 yrs
- Air quality 3/10 Moderate 2 unhealthy d/yr today · 3 by 30 yrs out
Nearby sold comps map
Loading sold comps map…
Walkable amenities ~0.75 mi
Loading nearby amenities…
Taxation est. · year 1
- Rental income
- $222,088
- − Mortgage interest
- −$108,390
- − Property taxes
- −$7,087
- − Insurance
- −$9,675
- − Repairs & maintenance
- −$17,767
- − Management
- −$17,767
- − Depreciation
- −$56,291
- Taxable income
- $5,111
- Est. tax owed @ 24.0%
- −$1,227
- After-tax cash flow
- $35,692/yr
For passive investors: Depreciation is non-cash, so a rental often shows a tax loss while cash-flowing — sheltering income. Rental losses are passive: they offset passive income freely, and up to $25,000/yr can offset ordinary (W-2) income if you actively participate and your MAGI is under $100k (phasing out to $0 by $150k); unused losses carry forward. On sale, claimed depreciation is recaptured at up to 25%, and gains may owe capital-gains tax (a 1031 exchange can defer both). Figures are a year-1 estimate at your 24.0% rate — not tax advice; consult a CPA.
Schools (NCES district)
- District
- Montauk Union Free School District
- NCES district ID
- 3619710
- Math proficiency
- 50% ▼ -10.00%
- Reading proficiency
- 60% ▬ 0.00%
- Median HH income
- $73,702
- Composite
- 50.99/100
- National rank
- #3831
- State rank
- #311 of 755 in NY
Livability — Montauk
- Score
- 69/100
- State rank
- #474
- US rank
- #8373
Category grades
Schools grade is shown separately in the Schools card above.
Census & demographics
- Census place
- Montauk, NY
- County
- Suffolk County · 679,920 people
- City population
- 4,223
- Metro
- New York-Newark-Jersey City, NY-NJ-PA
- Population (ZIP)
- 4,223
- Household income
- $142,961
- Rent vs Own
- Severe rent burden
- 20.0
Population outlook (Suffolk County) Hauer SSP2
- Today (2025)
- 1,505,262 people
- By 2030
- 1,498,318 · -0.5%
- By 2040
- 1,471,101 · -2.3%
- By 2050
- 1,424,848 · -5.3%
- By 2075
- 1,337,157 · -11.2%
- By 2100
- 1,217,720 · -19.1%
Race, ethnicity, and origin ACS 2023
- Neighborhood character
- Predominantly White (89%)
- Race & ethnicity
- White 89% Hispanic / Latino 6% Two or more races 4% Black 1%
- Hispanic origin (detail)
- Mexican 2% Dominican 1%
- Common ancestry
- Romanian 4% Scotch-Irish 3% Italian 3%
- Foreign-born
- 10% · Canada, Jamaica
- Languages at home
- 90% English-only · Spanish 4% Russian/Polish/Slavic 4% Other Indo-European 1%
Political lean MEDSL · Suffolk
- 2024 margin
- Lean R (+10.0) · D 45.0% · R 55.0%
- 2008→2024 swing
- -16.0pp toward R · 2008: 6.0pp · 2024: -10.0pp
- All cycles
- 2024: R+10.0 2020: R+0.0 2016: R+8.2 2012: D+2.9 2008: D+6.0
Not yet ingested
- Civics
- —
Market trends
- HPI YoY
- ▼ -1.78%
- Current HPI
- 577.7344
- Rent YoY
- —
- Metro
- New York-Newark-Jersey City, NY-NJ-PA
- State GDP YoY
- ▲ 2.60%
- F500 in state
- 92
Industry mix (Fortune 500 HQ in NY)
| Industry | F500 HQs | Revenue |
|---|---|---|
| Financial Services | 10 | $950B |
|
||
| Consumer Goods | 9 | $162B |
|
||
| Insurance | 4 | $225B |
|
||
| Telecommunications | 2 | $144B |
|
||
| Pharmaceuticals | 2 | $112B |
|
||
| Media / Entertainment | 2 | $69B |
|
||
Price history
+616.7% since first listed8 events — show timeline
- 2026-03-24 Pending — OneKey® MLS as Distributed by MLS Grid
- 2026-01-22 Listed $1,935,000 OneKey® MLS as Distributed by MLS Grid
- 2024-08-08 Listing Removed — OneKey® MLS as Distributed by MLS Grid
- 2024-05-01 Listing Removed — OneKey® MLS as Distributed by MLS Grid
- 2024-05-01 Listed $1,950,000 OneKey® MLS as Distributed by MLS Grid
- 2024-05-01 Listed $1,950,000 OneKey® MLS as Distributed by MLS Grid
- 2022-11-30 Rental Removed — ONEKEY
- 1999-07-14 Sold (Public Records) $270,000 Public Records
Property tax history
+1.1%/yrLatest (2025): $7,087 · +0.0% YoY. Source: county tax records.
Cash-flow waterfall
monthlySold comps — $/sqft
last 12 mo · ≤1 miLoading sold comps…