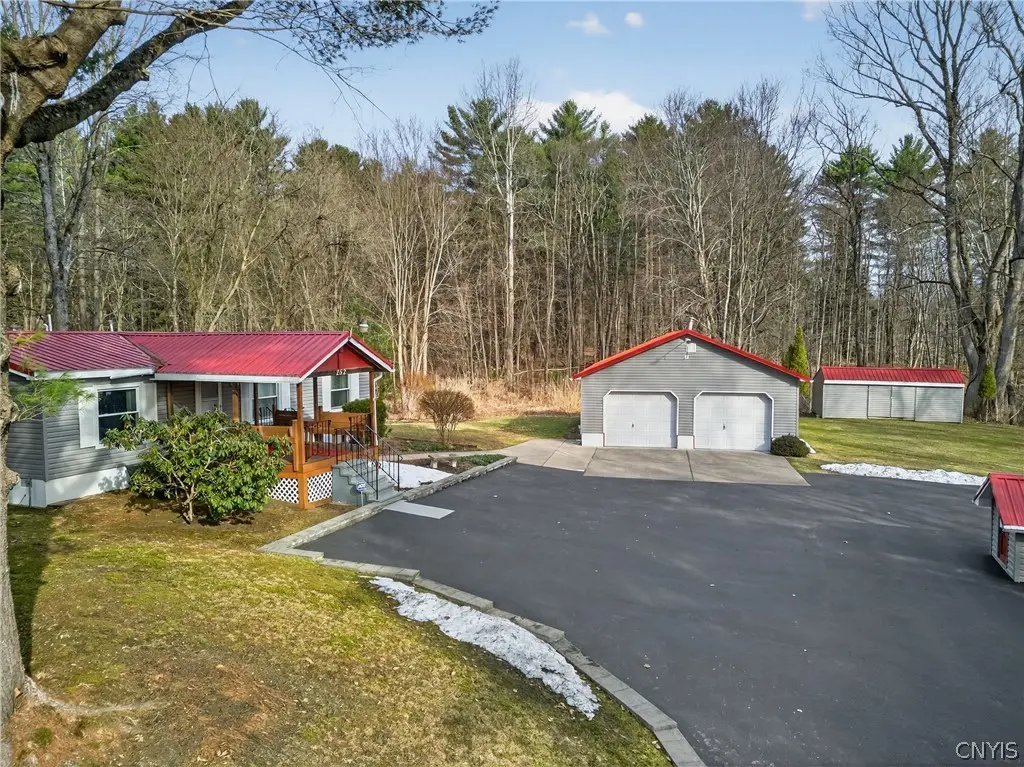
252 County Line Rd
Phoenix, NY 13135
$169,900D
3 bd · 2.0 ba ·
920 sqft ·
Built 1986
· Manufactured
· Pending
· 4 DOM
Cashflow @ list (25.0% down · 7.5%)
Estimated rent
$1,266/mo
Mortgage (P&I)
−$891
Tax + insurance
−$324
HOA
−$0
Vac / Maint / Mgmt
−$266
Net cashflow
$-215/mo
Annual
$-2,579/yr
Cap rate
4.78%
Cash-on-cash
-5.42%
DSCR
0.76
1% rule
0.74%
Cash to close
$47,572
Investor read
- This is a 3-bed/2.0-bath manufactured listed at $170k.
- At list price, monthly cash flow is $-215 ($-3k/yr) — negative.
- To cash-flow at today's rent, offer at most $132k (22.3% below list).
- To meet the 1% rule (rent ≥ 1% of price), the offer needs to be $127k (25.5% below list).
- Only 4 days on market — expect competitive offers; lowballing is unlikely to land.
- Recommended offer: $127k (25.5% below list) — sets the bar for 1% rule.
- In year one you build about $18k of equity ($1k loan paydown + $17k appreciation (10.0% local appreciation)).
- Location reads 67/100 on livability (#613 in NY) — a middle-class / working-renter tenant base. Strengths: cost of living A+, housing A+, crime B+; Watch: employment C-, amenities F, commute F.
- Phoenix Central School District (suburban): math 45% / reading 51% proficiency, ranked #416 of 590 in NY (top 70%) — families likely to look elsewhere, expect single-tenant / working-renter base with shorter leases.
- Zoned schools: Michael A Maroun Elementary School (math 36% / reading 45%, grade F, #1,413 of 2,108 statewide, top 67%, 667 students, 58% FRL); Emerson J Dillon Middle School (math 35% / reading 40%, grade F, #445 of 729 statewide, top 61%, 514 students, 60% FRL); John C Birdlebough High School (math 87% / reading 87%, grade A, #311 of 1,100 statewide, top 30%, 473 students, 59% FRL) — zoned schools average 59% FRL vs 41% district-wide (18 pts higher); higher-poverty schools than district average — tighter screening recommended.
- Market conditions: 40 active listings in the ZIP; 172 units permitted in Oswego County in 2024 (27 in 5+ unit buildings).
- Oswego County population projected at -23% by 2050 — secular population decline; favor cash flow + early exit over multi-decade hold.
- By year 3, paydown + projected appreciation supports a ~$46k cash-out refi (75% LTV) — recoverable capital for the next deal without selling this one.
- Cap rate 4.8% vs local median 1.9% in Phoenix — top-decile yield for the area; either an underpriced asset or a hidden risk that comps aren't pricing in. Stress-test before assuming the spread holds.
Questions for listing agent
- What do current leases actually rent for vs. the listed asking? Can we see a recent rent roll and the last 12 months of T-12 income?
- Is there a deadline driving the sale (1031 exchange, divorce, estate, relocation)? That informs how much negotiation room exists.
- The area grade is low — what's the realistic commute time and amenity access for the typical tenant pool here? Any planned neighborhood developments (good or bad) we should know about?
- What's the average days-on-market for RENTAL listings here right now (not sales)? A rising rental-DOM trend means longer vacancies and softer asking-rent achievability than the comps imply.
- What's the recent tenant-quality profile in this submarket — average credit score on applications, eviction rate, late-payment / NSF rate, and stable-employment percentage? A property-management company in the area should have these aggregated.
- How much new for-sale + rental construction is in the pipeline within 1–3 miles? Heavy new supply typically softens prices + rents 12–24 months out; constrained supply supports both.
CashFlowRE · CFR-QF2P3MDV8R5TSB
· Data 4 weeks ago
cashflowre.app · 2026-05-29