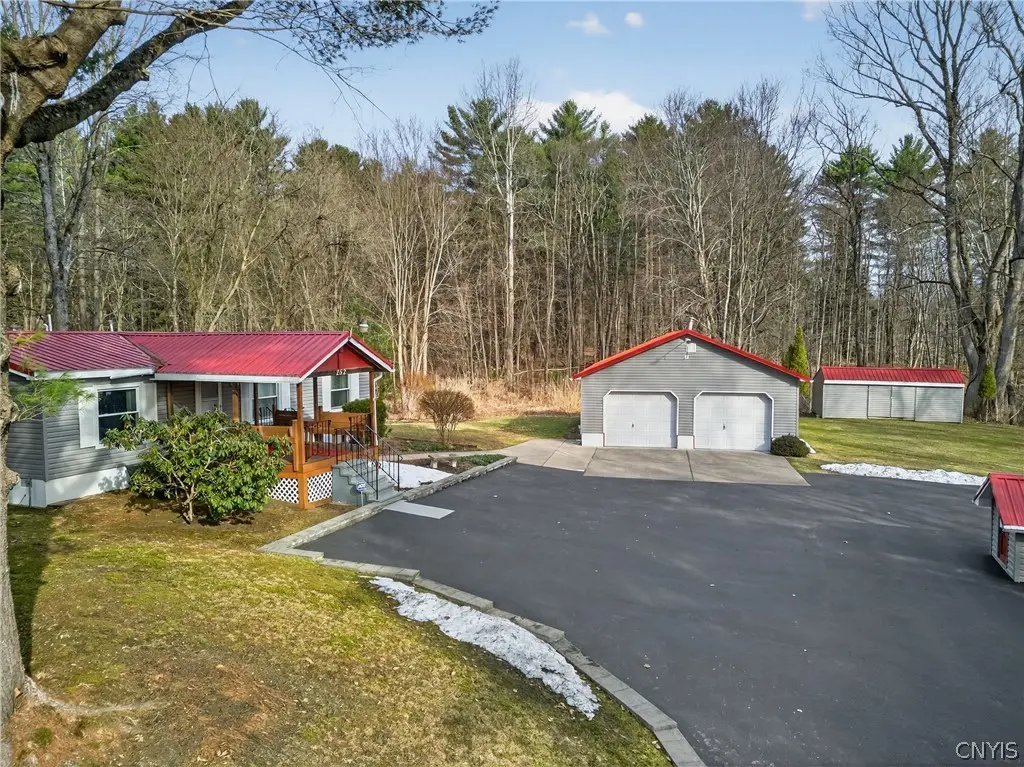
252 County Line Rd · Phoenix, NY
Flood risk 1/10 · Minimal
- FEMA flood zone
- X (unshaded)
- Chance of flooding over 30 yrs
- 0.0%
- Est. flood insurance / yr
- $507 – $1,088
Fire risk 3/10 · Minor
- Est. fire insurance / yr
- $691 – $1,283
Heat risk 2/10 · Minimal
- Hot days now (above 95°F)
- 7 days/yr
- Hot days in 30 yrs
- 16 days/yr
Wind risk 1/10 · Minimal
- Chance of severe wind over 30 yrs
- 0.0%
Air-quality risk 2/10 · Minimal
- Unhealthy air days now
- 1 days/yr
- Unhealthy air days in 30 yrs
- 1 days/yr
Risk factors via First Street. Map © Google.
Why this score? — see what drove the D grade
The composite is a weighted blend of 9 inputs, each scored 0–100. Each bar is that input's sub-score; the figure is the points it added to the 100-point composite (weight × sub-score).
- Appreciation +10.0/10.0
- ARV discount +9.0/15.0
- Cash flow +7.5/30.0
- Schools +4.1/10.0
- Livability +3.4/5.0
- Rent growth +2.5/5.0
- Condition / age +2.5/5.0
- 1% rule +2.4/10.0
- DSCR +1.6/10.0
$169,900
🖨 Deal sheet (PDF) 📄 Offer letter ✓ Due diligence
Listing remarks
SPOTLESS BOTH INSIDE AND OUT IS HOW I DESCRIBE THIS WONDERFUL COUNTRY FIND! THIS ONE-OWNER HOME HAS BEEN METICULOUSLY CARED FOR AND IS SITUATED IN A PICTURESQUE SETTING OFFERING 2.8 ACRES OF COUNTRY LAND. AS YOU ARRIVE, YOU WILL APPRECIATE THE EXPANSIVE PAVED DRIVEWAY. .. .PLENTY OF ROOM FOR THE LARGEST GATHERINGS, CAMPERS AND BOATS, TOO! THE COVERED FRONT PORCH IS WELCOMING TO GUESTS. .. COMPLETE WITH BUILT-IN BENCH SEATS! STEP INSIDE TO AN OPEN AND INVITING FLOOR PLAN, A REMODELED KITCHEN AND 2 BEDROOMS AND 2 FULL BATHS! MECHANICALS HAVE ALL BEEN UDATED AS WELL INCLUDING VINYL REPLACEMENT WINDOWS, A STEEL ROOF, NEW FLOOR COVERINGS AND A NEW BACK DECK CONSTRUCTED WITH MAINTENANCE-FREE
Key facts
- Covered front porch
- Built-in bench seats
- Remodeled kitchen
Tags
Neighborhood map
What this means for you Summary
Snapshot
- This is a 3-bed/2.0-bath manufactured listed at $170k.
Deal economics
- At list price, monthly cash flow is $-215 ($-3k/yr) — negative.
- To cash-flow at today's rent, offer at most $132k (22.3% below list).
- To meet the 1% rule (rent ≥ 1% of price), the offer needs to be $127k (25.5% below list).
- Recommended offer: $127k (25.5% below list) — sets the bar for 1% rule.
- Cap rate 4.8% vs local median 1.9% in Phoenix — top-decile yield for the area; either an underpriced asset or a hidden risk that comps aren't pricing in. Stress-test before assuming the spread holds.
Location & tenants
- Location reads 67/100 on livability (#613 in NY) — a middle-class / working-renter tenant base. Strengths: cost of living A+, housing A+, crime B+; Watch: employment C-, amenities F, commute F.
- Phoenix Central School District (suburban): math 45% / reading 51% proficiency, ranked #416 of 590 in NY (top 70%) — families likely to look elsewhere, expect single-tenant / working-renter base with shorter leases.
- Zoned schools: Michael A Maroun Elementary School (math 36% / reading 45%, grade F, #1,413 of 2,108 statewide, top 67%, 667 students, 58% FRL); Emerson J Dillon Middle School (math 35% / reading 40%, grade F, #445 of 729 statewide, top 61%, 514 students, 60% FRL); John C Birdlebough High School (math 87% / reading 87%, grade A, #311 of 1,100 statewide, top 30%, 473 students, 59% FRL) — zoned schools average 59% FRL vs 41% district-wide (18 pts higher); higher-poverty schools than district average — tighter screening recommended.
- Market conditions: 40 active listings in the ZIP; 172 units permitted in Oswego County in 2024 (27 in 5+ unit buildings).
Forward outlook
- In year one you build about $18k of equity ($1k loan paydown + $17k appreciation (10.0% local appreciation)).
- Oswego County population projected at -23% by 2050 — secular population decline; favor cash flow + early exit over multi-decade hold.
- By year 3, paydown + projected appreciation supports a ~$46k cash-out refi (75% LTV) — recoverable capital for the next deal without selling this one.
Negotiation context
- Only 4 days on market — expect competitive offers; lowballing is unlikely to land.
Questions for the listing agent
- What do current leases actually rent for vs. the listed asking? Can we see a recent rent roll and the last 12 months of T-12 income?
- Is there a deadline driving the sale (1031 exchange, divorce, estate, relocation)? That informs how much negotiation room exists.
- The area grade is low — what's the realistic commute time and amenity access for the typical tenant pool here? Any planned neighborhood developments (good or bad) we should know about?
- What's the average days-on-market for RENTAL listings here right now (not sales)? A rising rental-DOM trend means longer vacancies and softer asking-rent achievability than the comps imply.
- What's the recent tenant-quality profile in this submarket — average credit score on applications, eviction rate, late-payment / NSF rate, and stable-employment percentage? A property-management company in the area should have these aggregated.
- How much new for-sale + rental construction is in the pipeline within 1–3 miles? Heavy new supply typically softens prices + rents 12–24 months out; constrained supply supports both.
Investment metrics
- 1% rule
- 0.74% ✗
- Cap rate
- 4.78%
- Cash-on-cash
- -5.42%
- DSCR
- 0.76
- GRM
- 11.2
CMA / ARV
- ARV (on-the-fly)
- $175,720
- Comps found
- 1
Show comp detail 1 sale within ~0.75 mi
| Address | Dist | Beds/Ba | Sqft | Sold | Price | $/sf | Match |
|---|---|---|---|---|---|---|---|
| 252 County Line Rd | 0.00mi | 2/2.0 (-1) | 1,012 (+10%) | 1mo | $193,000 | $191 | 78 |
Match score weights: distance 35% · size 25% · config 20% · recency 20%. Top-matched comps best support the ARV.
Projected returns pro-forma
10.0% appreciation · 3.0% rent growth · sell at horizon
- IRR
- 20.4%
- Equity multiple
- 2.66×
- Total profit
- $78,889
- Equity at exit
- $153,059
- IRR
- 18.6%
- Equity multiple
- 6.11×
- Total profit
- $243,166
- Equity at exit
- $330,078
Cash invested: $47,572 (down + closing). Projections, not guarantees.
Landlord ↔ Tenant lean methodology
- Overall (STATE)
- 15 Strongly Tenant-Friendly
- State New York
- 15 Strongly Tenant-Friendly · D+10
- County
- — inherits STATE
- City
- — inherits STATE
ZIP-level market 13135
- Home prices YoY
- 8.8%
- Active inventory
- 40
- Price-to-rent
- 11.2×
Monthly cashflow live
- Estimated rent
- $1,266 medium interval (Pro) →
- Mortgage (P&I)
- −$891
- Tax from tax record
- −$253 /mo · $3,035/yr
- Insurance
- −$71
- HOA
- −$0
- Vacancy / Maint / Mgmt
- −$266
- Net cashflow
- $-215
Break-even live
Sensitivity live
| Price | -10% $-119 | -5% $-167 | +0% $-215 | +5% $-263 | +10% $-311 |
|---|---|---|---|---|---|
| Rent | -10% $-315 | -5% $-265 | +0% $-215 | +5% $-165 | +10% $-115 |
| Rate | -1.0pp $-129 | -0.5pp $-172 | base $-215 | +0.5pp $-259 | +1.0pp $-304 |
UW: 25.0% down · 7.5% · 30yr · 1.5% tax · 5.0% vac · 8.0% maint · 8.0% mgmt
Financing live
Cash to close
- Down payment
- $42,475
- Closing costs
- $5,097
- Reserves months
- —
- Total cash needed
- —
Loan-product check · same deal, 3 products live
Conventional
25% down · 7.5% · 30yr
- Down + closing
- —
- Monthly P&I
- —
- Monthly cashflow
- —
- DSCR
- —
- Eligible?
- —
Personal DTI + credit; lowest rate.
DSCR
20% down · 8.5% · 30yr
- Down + closing
- —
- Monthly P&I
- —
- Monthly cashflow
- —
- DSCR
- —
- Eligible?
- —
No personal income docs; deal must DSCR.
Hard money
10% down · 12.0% · 12mo
- Down + closing
- —
- Monthly P&I
- —
- Monthly cashflow
- —
- DSCR
- —
- Eligible?
- —
Short-term bridge; refi at stabilization.
Listing history 2 events
-
2026-03-31status Pending
-
2026-03-26$169,900 Active
ⓘ Source: listings_history table (triggers on properties + properties_extension) + one-shot
backfill from property_details.listing_events for pre-trigger history.
Tax reassessment forecast NY · Partial reset (capped growth)
- Current annual tax
- $3,035 · $253/mo
- Projected year-2 tax
- $3,035 · $253/mo
- Expected delta
- $0/yr ($0/mo · 0.0%)
ⓘ Screening estimate from a state-policy table — verify with the county assessor before closing.
Climate risk First Street
- Flood 1/10 Low FEMA zone X (unshaded) · 0% chance over 30 yrs
- Wildfire 3/10 Moderate
- Heat 2/10 Low 7 d/yr ≥95°F today · 16 d/yr by 30 yrs out
- Wind 1/10 Low 0% chance of damaging wind over 30 yrs
- Air quality 2/10 Low 1 unhealthy d/yr today · 1 by 30 yrs out
Nearby sold comps map
Loading sold comps map…
Walkable amenities ~0.75 mi
Loading nearby amenities…
Taxation est. · year 1
- Rental income
- $15,187
- − Mortgage interest
- −$9,517
- − Property taxes
- −$3,035
- − Insurance
- −$850
- − Repairs & maintenance
- −$1,215
- − Management
- −$1,215
- − Depreciation
- −$4,943
- Taxable loss
- −$5,587
- Est. tax savings @ 24.0%
- +$1,341
- After-tax cash flow
- $-1,238/yr
For passive investors: Depreciation is non-cash, so a rental often shows a tax loss while cash-flowing — sheltering income. Rental losses are passive: they offset passive income freely, and up to $25,000/yr can offset ordinary (W-2) income if you actively participate and your MAGI is under $100k (phasing out to $0 by $150k); unused losses carry forward. On sale, claimed depreciation is recaptured at up to 25%, and gains may owe capital-gains tax (a 1031 exchange can defer both). Figures are a year-1 estimate at your 24.0% rate — not tax advice; consult a CPA.
Schools (NCES district)
- District
- Phoenix Central School District
- NCES district ID
- 3622920
- Math proficiency
- 45% ▼ -14.00%
- Reading proficiency
- 51% ▲ 5.00%
- Median HH income
- $52,419
- Composite
- 41.34/100
- National rank
- #3500
- State rank
- #416 of 590 in NY
Livability — Phoenix
- Score
- 67/100
- State rank
- #613
- US rank
- #11120
Category grades
Schools grade is shown separately in the Schools card above.
Census & demographics
- Population (ZIP)
- 6,229
Population outlook (Oswego County) Hauer SSP2
- Today (2025)
- 114,465 people
- By 2030
- 109,968 · -3.9%
- By 2040
- 99,205 · -13.3%
- By 2050
- 87,979 · -23.1%
- By 2075
- 65,100 · -43.1%
- By 2100
- 47,117 · -58.8%
Race, ethnicity, and origin ACS 2023
- Neighborhood character
- Predominantly White (92%)
- Race & ethnicity
- White 92% Two or more races 5% Hispanic / Latino 2% Asian 2%
- Common ancestry
- Lithuanian 8% Romanian 5% Slovak 2%
- Foreign-born
- 2% · China, Vietnam
- Languages at home
- 97% English-only · Russian/Polish/Slavic 1% Vietnamese 1%
Political lean MEDSL · Oswego
- 2024 margin
- Strong R (+24.2) · D 37.9% · R 62.1%
- 2008→2024 swing
- -26.6pp toward R · 2008: 2.5pp · 2024: -24.2pp
- All cycles
- 2024: R+24.2 2020: R+20.2 2016: R+23.2 2012: D+7.9 2008: D+2.5
Not yet ingested
- Civics
- —
Market trends
- HPI YoY
- ▲ 25.32%
- Current HPI
- 313.5591
- Rent YoY
- —
- Metro
- —
- State GDP YoY
- ▲ 2.60%
- F500 in state
- 92
Industry mix (Fortune 500 HQ in NY)
| Industry | F500 HQs | Revenue |
|---|---|---|
| Financial Services | 10 | $950B |
|
||
| Consumer Goods | 9 | $162B |
|
||
| Insurance | 4 | $225B |
|
||
| Telecommunications | 2 | $144B |
|
||
| Pharmaceuticals | 2 | $112B |
|
||
| Media / Entertainment | 2 | $69B |
|
||
Price history
2 events — show timeline
- 2026-03-31 Pending — CNYIS
- 2026-03-26 Listed $169,900 CNYIS
Property tax history
+3.1%/yrLatest (2025): $3,035 · -2.1% YoY. Source: county tax records.
Cash-flow waterfall
monthlySold comps — $/sqft
last 12 mo · ≤1 miLoading sold comps…