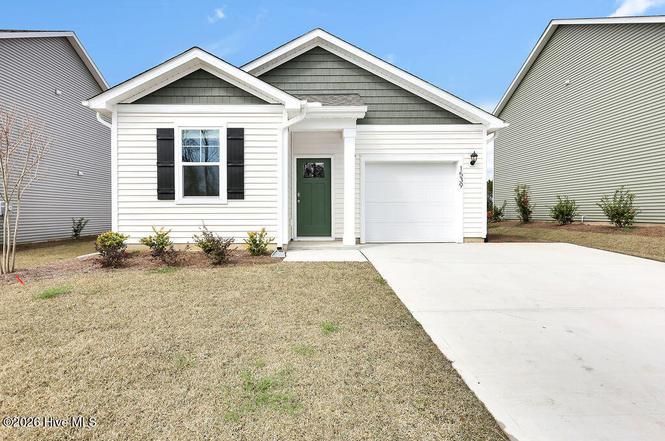
1539 W White Egret Ln NE Lot 761
Bolivia, NC 28422
$254,999D-
3 bd · 2.0 ba ·
1,281 sqft ·
Built 2025
· SingleFamily
· Pending
· 135 DOM
Cashflow @ list (25.0% down · 7.5%)
Estimated rent
$2,211/mo
Mortgage (P&I)
−$1,337
Tax + insurance
−$425
HOA
−$46
Vac / Maint / Mgmt
−$464
Net cashflow
$-61/mo
Annual
$-736/yr
Cap rate
6.00%
Cash-on-cash
-1.03%
DSCR
0.95
1% rule
0.87%
Cash to close
$71,400
Investor read
- This is a 3-bed/2.0-bath single-family listed at $255k.
- At list price, monthly cash flow is $-61 ($-736/yr) — negative.
- To cash-flow at today's rent, offer at most $246k (3.5% below list).
- To meet the 1% rule (rent ≥ 1% of price), the offer needs to be $221k (13.3% below list).
- It's been on market 135 days — a 12% lower offer ($224k) is reasonable based on typical stale-listing flexibility.
- Recommended offer: $221k (13.3% below list) — sets the bar for 1% rule.
- Local home prices are declining (-3.0%/yr); year-one equity from $2k of loan paydown is wiped out by about $8k of value loss. Plan a longer hold.
- Location reads 59/100 on livability (#549 in NC) — a working-class tenant base; expect higher turnover. Strengths: health & safety A+, cost of living B; Watch: amenities F, commute F, employment F.
- Brunswick County Schools (rural): math 45% / reading 47% proficiency, ranked #82 of 178 in NC (top 46%) — families likely to look elsewhere, expect single-tenant / working-renter base with shorter leases.
- Zoned schools: Supply Elementary (math 46% / reading 39%, grade F, #625 of 1,410 statewide, top 45%, 539 students, 99% FRL); Cedar Grove Middle (math 30% / reading 36%, grade F, #305 of 475 statewide, top 65%, 434 students, 99% FRL); South Brunswick High (math 62% / reading 57%, grade C+, #216 of 535 statewide, top 43%, 1,172 students, 100% FRL) — zoned schools average 99% FRL vs 53% district-wide (46 pts higher); higher-poverty schools than district average — tighter screening recommended.
- Market conditions: 569 active listings in the ZIP; 6,112 units permitted in Brunswick County in 2024 (990 in 5+ unit buildings).
- Brunswick County population projected at +36% by 2050 — long-run rental-demand tailwind backs the buy-and-hold thesis.
- 4 sale attempts; this cycle's ask has dropped $29k (10%) from the opening price — seller is motivated, your offer sets the floor, not the list.
- Cap rate 6.0% vs local median 4.8% in Bolivia — meaningfully above typical; check what's discounted (condition, days-on-market, listing class) to confirm the premium yield is real.
- This rent runs 38% of the median local income ($69k/yr) — at the standard rent-burdened threshold; future hikes will face affordability resistance.
Questions for listing agent
- What do current leases actually rent for vs. the listed asking? Can we see a recent rent roll and the last 12 months of T-12 income?
- It's been on market 135 days. Have you received any prior offers? Is the seller open to a 13% concession, seller financing, or rate buy-down credit?
- What does the HOA fee cover, when was the last increase, and are there any pending special assessments or reserve-fund shortfalls?
- Why hasn't it sold? Are there any deal-killer items the seller is aware of (foundation, flood, title, zoning, code violations)?
- Is there a deadline driving the sale (1031 exchange, divorce, estate, relocation)? That informs how much negotiation room exists.
- Schools are D-rated, which usually means shorter tenancies and higher turnover. Who's the typical renter profile here, and what's been the actual vacancy rate?
- The area grade is low — what's the realistic commute time and amenity access for the typical tenant pool here? Any planned neighborhood developments (good or bad) we should know about?
- What's the average days-on-market for RENTAL listings here right now (not sales)? A rising rental-DOM trend means longer vacancies and softer asking-rent achievability than the comps imply.
CashFlowRE · CFR-QG42PT3PWVFAAA
· Data 3 weeks ago
cashflowre.app · 2026-05-29