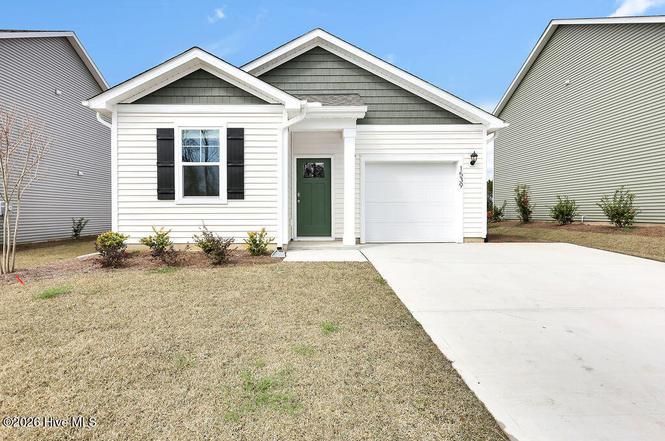
1539 W White Egret Ln NE Lot 761 · Bolivia, NC
Flood risk No data
- FEMA flood zone
- —
- Chance of flooding over 30 yrs
- —
- Est. flood insurance / yr
- —
Fire risk No data
- Est. fire insurance / yr
- —
Heat risk No data
- Hot days now (above threshold)
- —
- Hot days in 30 yrs
- —
Wind risk No data
- Chance of severe wind over 30 yrs
- —
Air-quality risk No data
- Unhealthy air days now
- —
- Unhealthy air days in 30 yrs
- —
Risk factors via First Street. Map © Google.
Why this score? — see what drove the D- grade
The composite is a weighted blend of 9 inputs, each scored 0–100. Each bar is that input's sub-score; the figure is the points it added to the 100-point composite (weight × sub-score).
- Cash flow +12.0/30.0
- ARV discount +7.7/15.0
- Schools +3.9/10.0
- 1% rule +3.7/10.0
- DSCR +3.5/10.0
- Livability +3.0/5.0
- Rent growth +2.5/5.0
- Condition / age +2.5/5.0
- Appreciation +0.0/10.0
$254,999
🖨 Deal sheet 📄 Offer letter ✓ Due diligence
Listing remarks
Get ready for SALT LIFE! Come check out our new phase in Eagle Creek, located in a serene area of Brunswick County, and only 15 minutes to the beaches of Oak Island. This homesite features a beautiful one-story Devon w/ 3 bedrooms and 2 full baths, an open concept living area, and storage closets galore throughout the home. Stainless Steel Appliances in the well thought out kitchen with granite countertops in the kitchen and a large island that is perfect for entertaining. The two bathrooms feature granite countertops. The primary suite has a spacious bedroom with a walk in closet, and the bath has a walk in shower. Architectural shingles, garage door opener, and screens on all windows! S
Key facts
- Walk in closet
- Walk in shower
- 6,534 sq ft lot
Tags
Neighborhood map
What this means for you Summary
Snapshot
- This is a 3-bed/2.0-bath single-family listed at $255k.
Deal economics
- At list price, monthly cash flow is $-61 ($-736/yr) — negative.
- To cash-flow at today's rent, offer at most $246k (3.5% below list).
- To meet the 1% rule (rent ≥ 1% of price), the offer needs to be $221k (13.3% below list).
- Recommended offer: $221k (13.3% below list) — sets the bar for 1% rule.
- Cap rate 6.0% vs local median 4.8% in Bolivia — meaningfully above typical; check what's discounted (condition, days-on-market, listing class) to confirm the premium yield is real.
Location & tenants
- Location reads 59/100 on livability (#549 in NC) — a working-class tenant base; expect higher turnover. Strengths: health & safety A+, cost of living B; Watch: amenities F, commute F, employment F.
- Brunswick County Schools (rural): math 45% / reading 47% proficiency, ranked #82 of 178 in NC (top 46%) — families likely to look elsewhere, expect single-tenant / working-renter base with shorter leases.
- Zoned schools: Supply Elementary (math 46% / reading 39%, grade F, #625 of 1,410 statewide, top 45%, 539 students, 99% FRL); Cedar Grove Middle (math 30% / reading 36%, grade F, #305 of 475 statewide, top 65%, 434 students, 99% FRL); South Brunswick High (math 62% / reading 57%, grade C+, #216 of 535 statewide, top 43%, 1,172 students, 100% FRL) — zoned schools average 99% FRL vs 53% district-wide (46 pts higher); higher-poverty schools than district average — tighter screening recommended.
- Market conditions: 569 active listings in the ZIP; 6,112 units permitted in Brunswick County in 2024 (990 in 5+ unit buildings).
- This rent runs 38% of the median local income ($69k/yr) — at the standard rent-burdened threshold; future hikes will face affordability resistance.
Forward outlook
- Local home prices are declining (-3.0%/yr); year-one equity from $2k of loan paydown is wiped out by about $8k of value loss. Plan a longer hold.
- Brunswick County population projected at +36% by 2050 — long-run rental-demand tailwind backs the buy-and-hold thesis.
Negotiation context
- It's been on market 135 days — a 12% lower offer ($224k) is reasonable based on typical stale-listing flexibility.
- 4 sale attempts; this cycle's ask has dropped $29k (10%) from the opening price — seller is motivated, your offer sets the floor, not the list.
Questions for the listing agent
- What do current leases actually rent for vs. the listed asking? Can we see a recent rent roll and the last 12 months of T-12 income?
- It's been on market 135 days. Have you received any prior offers? Is the seller open to a 13% concession, seller financing, or rate buy-down credit?
- What does the HOA fee cover, when was the last increase, and are there any pending special assessments or reserve-fund shortfalls?
- Why hasn't it sold? Are there any deal-killer items the seller is aware of (foundation, flood, title, zoning, code violations)?
- Is there a deadline driving the sale (1031 exchange, divorce, estate, relocation)? That informs how much negotiation room exists.
- Schools are D-rated, which usually means shorter tenancies and higher turnover. Who's the typical renter profile here, and what's been the actual vacancy rate?
- The area grade is low — what's the realistic commute time and amenity access for the typical tenant pool here? Any planned neighborhood developments (good or bad) we should know about?
- What's the average days-on-market for RENTAL listings here right now (not sales)? A rising rental-DOM trend means longer vacancies and softer asking-rent achievability than the comps imply.
- What's the recent tenant-quality profile in this submarket — average credit score on applications, eviction rate, late-payment / NSF rate, and stable-employment percentage? A property-management company in the area should have these aggregated.
- How much new for-sale + rental construction is in the pipeline within 1–3 miles? Heavy new supply typically softens prices + rents 12–24 months out; constrained supply supports both.
Investment metrics
- 1% rule
- 0.87% ✗
- Cap rate
- 6.00%
- Cash-on-cash
- -1.03%
- DSCR
- 0.95
- GRM
- 9.6
CMA / ARV
- ARV (on-the-fly)
- $256,200
- Comps found
- 12
Show comp detail 12 sales within ~0.75 mi
| Address | Dist | Beds/Ba | Sqft | Sold | Price | $/sf | Match |
|---|---|---|---|---|---|---|---|
| 1523 White Egret Ln NE Lot 757 | 0.06mi | 3/2.0 | 1,281 (0%) | 6mo | $249,999 | $195 | 92 |
| 1503 W White Egret Ln NE Lot 752 | 0.14mi | 3/2.0 | 1,281 (0%) | 3mo | $254,999 | $199 | 91 |
| 126 Spotted Owl Way NE Lot 328 | 0.14mi | 3/2.0 | 1,281 (0%) | 14mo | $243,999 | $190 | 82 |
| 1061 High Tide St SE #26 | 0.35mi | 3/2.0 | 1,202 (-6%) | 5mo | $244,000 | $203 | 69 |
| 185 Kite Cir NE Lot 609 | 0.51mi | 3/2.0 | 1,281 (0%) | 11mo | $256,000 | $200 | 67 |
| 199 Kite Cir NE Lot 607 | 0.53mi | 3/2.0 | 1,281 (0%) | 10mo | $256,590 | $200 | 67 |
| 258 Ocean Pointe Blvd SE #43 | 0.44mi | 3/2.0 | 1,202 (-6%) | 7mo | $249,300 | $207 | 63 |
| 503 Tawny Eagle Ct NE Lot 605 | 0.57mi | 3/2.0 | 1,281 (0%) | 13mo | $254,999 | $199 | 62 |
| 222 Kite Cir NE Lot 664 | 0.56mi | 3/2.0 | 1,281 (0%) | 14mo | $261,990 | $205 | 62 |
| 224 Ocean Pointe Blvd SE #49 | 0.36mi | 3/2.0 | 1,202 (-6%) | 13mo | $239,995 | $200 | 62 |
| 1073 High Tide St SE #29 | 0.47mi | 3/2.0 | 1,202 (-6%) | 7mo | $262,000 | $218 | 62 |
| 229 Ocean Pointe Blvd SE #7 | 0.43mi | 3/2.0 | 1,202 (-6%) | 12mo | $244,470 | $203 | 60 |
Match score weights: distance 35% · size 25% · config 20% · recency 20%. Top-matched comps best support the ARV.
Projected returns pro-forma
-3.0% appreciation · 3.0% rent growth · sell at horizon
- IRR
- -18.0%
- Equity multiple
- 0.37×
- Total profit
- $-45,165
- Equity at exit
- $38,021
- IRR
- -10.1%
- Equity multiple
- 0.38×
- Total profit
- $-44,107
- Equity at exit
- $22,048
Cash invested: $71,400 (down + closing). Projections, not guarantees.
Landlord ↔ Tenant lean methodology
- Overall (STATE)
- 85 Strongly Landlord-Friendly
- State North Carolina
- 85 Strongly Landlord-Friendly · R+3
- County
- — inherits STATE
- City
- — inherits STATE
ZIP-level market 28422
- Home prices YoY
- -23.8%
- Active inventory
- 569
- Price-to-rent
- 9.6×
Monthly cashflow live
- Estimated rent
- $2,211 medium interval (Pro) →
- Mortgage (P&I)
- −$1,337
- Tax est. 1.5%
- −$319 /mo · $3,825/yr
- Insurance
- −$106
- HOA
- −$46
- Vacancy / Maint / Mgmt
- −$464
- Net cashflow
- $-61
Break-even live
UW: 25.0% down · 7.5% · 30yr · 1.5% tax · 5.0% vac · 8.0% maint · 8.0% mgmt
Financing live
Cash to close
- Down payment
- $63,750
- Closing costs
- $7,650
- Reserves months
- —
- Total cash needed
- —
Loan-product check · same deal, 3 products live
Conventional
25% down · 7.5% · 30yr
- Down + closing
- —
- Monthly P&I
- —
- Monthly cashflow
- —
- DSCR
- —
- Eligible?
- —
Personal DTI + credit; lowest rate.
DSCR
20% down · 8.5% · 30yr
- Down + closing
- —
- Monthly P&I
- —
- Monthly cashflow
- —
- DSCR
- —
- Eligible?
- —
No personal income docs; deal must DSCR.
Hard money
10% down · 12.0% · 12mo
- Down + closing
- —
- Monthly P&I
- —
- Monthly cashflow
- —
- DSCR
- —
- Eligible?
- —
Short-term bridge; refi at stabilization.
HOA detail
- Monthly dues
- $46 · $552/yr
Listing history 14 events
-
2026-03-29status Pending
-
2026-03-15status Active
-
2026-03-08status Pending
-
2026-02-07status Active
-
2025-12-11status Pending
-
2025-11-25status Pending
-
2025-11-14status Active
-
2025-10-11status Pending
-
2025-10-07price $254,999
-
2025-09-22price $259,999
-
2025-08-26price $269,999
-
2025-08-18price $274,999
-
2025-08-11price $279,999
-
2025-07-22$283,990 Active
ⓘ Source: listings_history table (triggers on properties + properties_extension) + one-shot
backfill from property_details.listing_events for pre-trigger history.
Nearby sold comps map
Loading sold comps map…
Walkable amenities ~0.75 mi
Loading nearby amenities…
Taxation est. · year 1
- Rental income
- $26,535
- − Mortgage interest
- −$14,284
- − Property taxes
- −$3,825
- − Insurance
- −$1,275
- − Repairs & maintenance
- −$2,123
- − Management
- −$2,123
- − HOA
- −$552
- − Depreciation
- −$7,418
- Taxable loss
- −$5,064
- Est. tax savings @ 24.0%
- +$1,215
- After-tax cash flow
- $480/yr
For passive investors: Depreciation is non-cash, so a rental often shows a tax loss while cash-flowing — sheltering income. Rental losses are passive: they offset passive income freely, and up to $25,000/yr can offset ordinary (W-2) income if you actively participate and your MAGI is under $100k (phasing out to $0 by $150k); unused losses carry forward. On sale, claimed depreciation is recaptured at up to 25%, and gains may owe capital-gains tax (a 1031 exchange can defer both). Figures are a year-1 estimate at your 24.0% rate — not tax advice; consult a CPA.
Schools (NCES district)
- District
- Brunswick County Schools
- NCES district ID
- 3700420
- Math proficiency
- 45% ▲ 4.00%
- Reading proficiency
- 47% ▲ 4.00%
- Median HH income
- $47,494
- Composite
- 39.23/100
- National rank
- #4011
- State rank
- #82 of 178 in NC
Livability — Bolivia
- Score
- 59/100
- State rank
- #549
- US rank
- #20206
Category grades
Schools grade is shown separately in the Schools card above.
Census & demographics
- County
- Brunswick County · 131,536 people
- City population
- 10,059
- Metro
- Myrtle Beach-Conway-North Myrtle Beach, SC-NC
- Population (ZIP)
- 10,059
- Household income
- $69,412
- Rent vs Own
- Severe rent burden
- 243.0
Population outlook (Brunswick County) Hauer SSP2
- Today (2025)
- 152,111 people
- By 2030
- 165,705 · +8.9%
- By 2040
- 188,494 · +23.9%
- By 2050
- 206,228 · +35.6%
- By 2075
- 237,876 · +56.4%
- By 2100
- 251,451 · +65.3%
Race, ethnicity, and origin ACS 2023
- Neighborhood character
- Predominantly White (80%)
- Race & ethnicity
- White 80% Black 9% Two or more races 8% Hispanic / Latino 3% Native American 1%
- Common ancestry
- Slovak 4% Lithuanian 3% Romanian 2%
- Foreign-born
- 3% · Canada
- Languages at home
- 95% English-only · Spanish 4%
Political lean MEDSL · Brunswick
- 2024 margin
- Strong R (+24.9) · D 37.2% · R 62.0%
- 2008→2024 swing
- -6.9pp toward R · 2008: -17.9pp · 2024: -24.9pp
- All cycles
- 2024: R+24.9 2020: R+25.0 2016: R+28.7 2012: R+22.2 2008: R+17.9
Not yet ingested
- Civics
- —
Market trends
- HPI YoY
- ▼ -44.19%
- Current HPI
- 141.1956
- Rent YoY
- —
- Metro
- Myrtle Beach-Conway-North Myrtle Beach, SC-NC
- State GDP YoY
- ▲ 3.28%
- F500 in state
- 26
Industry mix (Fortune 500 HQ in NC)
| Industry | F500 HQs | Revenue |
|---|---|---|
| Financial Services | 2 | $213B |
|
||
| Retail | 2 | $95B |
|
||
| Industrial Conglomerate | 1 | $38B |
|
||
| Metals / Steel | 1 | $35B |
|
||
| Utilities | 1 | $30B |
|
||
| Industrial Machinery | 1 | $19B |
|
||
Price history
-10.2% since first listed14 events — show timeline
- 2026-03-29 Pending — Hive MLS
- 2026-03-15 Relisted — Hive MLS
- 2026-03-08 Pending — Hive MLS
- 2026-02-07 Relisted — Hive MLS
- 2025-12-11 Pending — Hive MLS
- 2025-11-25 Pending — Hive MLS
- 2025-11-14 Relisted — Hive MLS
- 2025-10-11 Pending — Hive MLS
- 2025-10-07 Price Changed $254,999 Hive MLS
- 2025-09-22 Price Changed $259,999 Hive MLS
- 2025-08-26 Price Changed $269,999 Hive MLS
- 2025-08-18 Price Changed $274,999 Hive MLS
- 2025-08-11 Price Changed $279,999 Hive MLS
- 2025-07-22 Listed $283,990 Hive MLS
Cash-flow waterfall
monthlySold comps — $/sqft
last 12 mo · ≤1 miLoading sold comps…