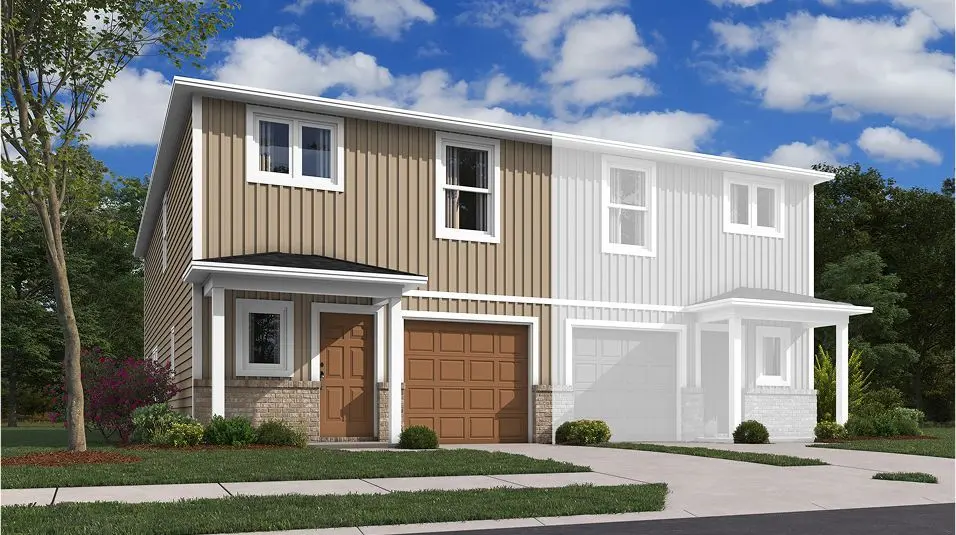
RC Stockwell Plan
Bentonville, AR 72713
$268,800D
3 bd · 2.5 ba ·
1,599 sqft ·
Built —
· Townhouse
· Active
· 53 DOM
Cashflow @ list (25.0% down · 7.5%)
Estimated rent
$1,816/mo
Mortgage (P&I)
−$1,409
Tax + insurance
−$448
HOA
−$0
Vac / Maint / Mgmt
−$381
Net cashflow
$-422/mo
Annual
$-5,058/yr
Cap rate
4.41%
Cash-on-cash
-6.72%
DSCR
0.70
1% rule
0.68%
Cash to close
$75,217
Investor read
- This is a 3-bed/2.5-bath townhouse listed at $269k.
- At list price, monthly cash flow is $-422 ($-5k/yr) — negative.
- To cash-flow at today's rent, offer at most $208k (22.8% below list).
- To meet the 1% rule (rent ≥ 1% of price), the offer needs to be $182k (32.4% below list).
- It's been on market 53 days — a 3% lower offer ($261k) is reasonable based on typical stale-listing flexibility.
- Recommended offer: $182k (32.4% below list) — sets the bar for 1% rule.
- In year one you build about $29k of equity ($2k loan paydown + $27k appreciation (10.0% local appreciation)).
- Location reads 83/100 on livability (#2 in AR, #864 nationally) — a professional / high-income tenant draw. Strengths: employment A+, housing A+, health & safety A+; Watch: amenities F.
- Bentonville School District (urban): math 59% / reading 59% proficiency, ranked #3 of 238 in AR (top 1%) — acceptable for families but not a draw, mixed tenant base, ~2y average lease.
- Market conditions: Rents flat; 690 active listings in the ZIP; 40 comparable units currently listed for rent nearby; rentals at typical pace (median 24d on market — plan ~3-4 weeks tenant-placement turnaround); high-income renter base; 4,359 units permitted in Benton County in 2024 (402 in 5+ unit buildings).
- Benton County population projected at +56% by 2050 — long-run rental-demand tailwind backs the buy-and-hold thesis.
- By year 2, paydown + projected appreciation supports a ~$46k cash-out refi (75% LTV) — recoverable capital for the next deal without selling this one.
- Climate carrying-cost: moderate wildfire risk; extreme-heat days projected 7→18/yr by 2055 (HVAC capex compounding) — expect insurance premiums to compound above CPI over the hold.
- Cap rate 4.4% vs local median 2.6% in Bentonville — top-decile yield for the area; either an underpriced asset or a hidden risk that comps aren't pricing in. Stress-test before assuming the spread holds.
Questions for listing agent
- What do current leases actually rent for vs. the listed asking? Can we see a recent rent roll and the last 12 months of T-12 income?
- It's been on market 53 days. Have you received any prior offers? Is the seller open to a 32% concession, seller financing, or rate buy-down credit?
- Is there a deadline driving the sale (1031 exchange, divorce, estate, relocation)? That informs how much negotiation room exists.
- Schools are A-rated — typically a magnet for longer-tenancy family renters. What's the average tenant stay here, and is there a school-zone premium baked into asking?
- The area grade is low — what's the realistic commute time and amenity access for the typical tenant pool here? Any planned neighborhood developments (good or bad) we should know about?
- What's the average days-on-market for RENTAL listings here right now (not sales)? A rising rental-DOM trend means longer vacancies and softer asking-rent achievability than the comps imply.
- What's the recent tenant-quality profile in this submarket — average credit score on applications, eviction rate, late-payment / NSF rate, and stable-employment percentage? A property-management company in the area should have these aggregated.
- How much new for-sale + rental construction is in the pipeline within 1–3 miles? Heavy new supply typically softens prices + rents 12–24 months out; constrained supply supports both.
CashFlowRE · CFR-QH7GCK8MWGEASE
· Data 2 days ago
cashflowre.app · 2026-05-29