 🏗️ New Construction
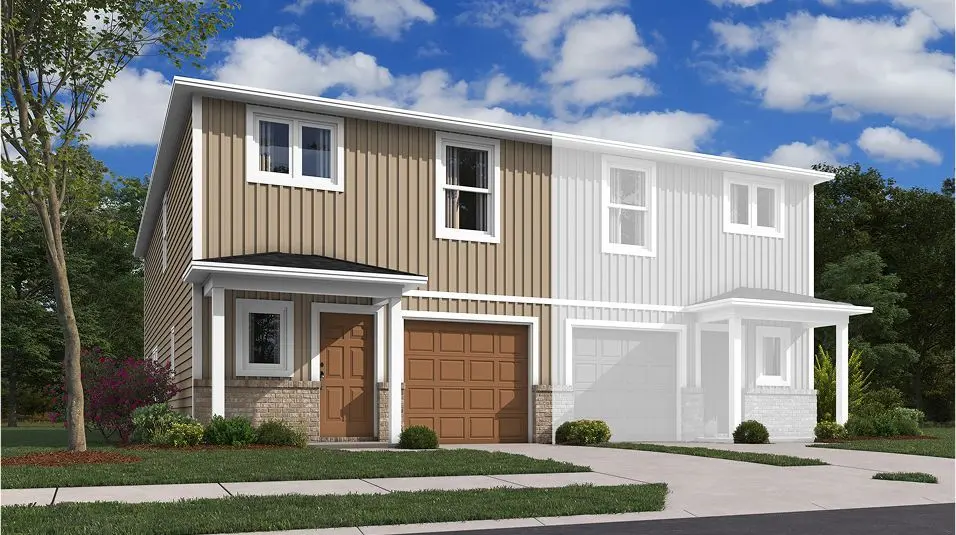
RC Stockwell Plan · Bentonville, AR
Flood risk 1/10 · Minimal
- FEMA flood zone
- X (unshaded)
- Chance of flooding over 30 yrs
- 0.0%
- Est. flood insurance / yr
- $507 – $1,088
Fire risk 5/10 · Moderate
- Est. fire insurance / yr
- $1,499 – $2,785
Heat risk 5/10 · Moderate
- Hot days now (above 105°F)
- 7 days/yr
- Hot days in 30 yrs
- 18 days/yr
Wind risk 3/10 · Minor
- Chance of severe wind over 30 yrs
- 5.0%
Air-quality risk 1/10 · Minimal
- Unhealthy air days now
- 0 days/yr
- Unhealthy air days in 30 yrs
- 0 days/yr
Risk factors via First Street. Map © Google.
Why this score? — see what drove the D grade
The composite is a weighted blend of 9 inputs, each scored 0–100. Each bar is that input's sub-score; the figure is the points it added to the 100-point composite (weight × sub-score).
- Appreciation +10.0/10.0
- ARV discount +7.5/15.0
- Cash flow +6.8/30.0
- Schools +5.2/10.0
- Livability +4.2/5.0
- Rent growth +2.6/5.0
- Condition / age +2.5/5.0
- 1% rule +1.8/10.0
- DSCR +1.0/10.0
$268,800
🖨 Deal sheet 📄 Offer letter ✓ Due diligence
Listing remarks
Upon entry into this new two-story home, the foyer flows down to a welcoming and airy main living space. It showcases a sprawling living room made for gatherings with direct access to a modern kitchen and an intimate dining area. Residing upstairs are all three bedrooms and a versatile loft, ideal as a custom work space. The owner's suite is tucked into a quiet corner with its own private bathroom and walk-in closet.
Key facts
- Intimate dining area
- Walk-in closet
- Private bathroom
Tags
Property features AI
Finance
- Other: Listing status: Active
- Financial info: List price $268,800
Exterior
- Parking: Detached or attached 1-car garage (1 parking space total)
- Home design: RC Stockwell plan; New construction plan
- Construction: Built as part of 2026 plan
- Exterior features: Living area of 1,599 (plan)
Interior
- Bedrooms: 3 bedrooms
- Bathrooms: 2 full bathrooms and 1 half bathroom
- Interior features: Open living area (plan)
Neighborhood map
What this means for you Summary
Snapshot
- This is a 3-bed/2.5-bath townhouse listed at $269k.
Deal economics
- At list price, monthly cash flow is $-422 ($-5k/yr) — negative.
- To cash-flow at today's rent, offer at most $208k (22.8% below list).
- To meet the 1% rule (rent ≥ 1% of price), the offer needs to be $182k (32.4% below list).
- Recommended offer: $182k (32.4% below list) — sets the bar for 1% rule.
- Cap rate 4.4% vs local median 2.6% in Bentonville — top-decile yield for the area; either an underpriced asset or a hidden risk that comps aren't pricing in. Stress-test before assuming the spread holds.
Location & tenants
- Location reads 83/100 on livability (#2 in AR, #864 nationally) — a professional / high-income tenant draw. Strengths: employment A+, housing A+, health & safety A+; Watch: amenities F.
- Bentonville School District (urban): math 59% / reading 59% proficiency, ranked #3 of 238 in AR (top 1%) — acceptable for families but not a draw, mixed tenant base, ~2y average lease.
- Market conditions: Rents flat; 690 active listings in the ZIP; 40 comparable units currently listed for rent nearby; rentals at typical pace (median 24d on market — plan ~3-4 weeks tenant-placement turnaround); high-income renter base; 4,359 units permitted in Benton County in 2024 (402 in 5+ unit buildings).
Forward outlook
- In year one you build about $29k of equity ($2k loan paydown + $27k appreciation (10.0% local appreciation)).
- Benton County population projected at +56% by 2050 — long-run rental-demand tailwind backs the buy-and-hold thesis.
- By year 2, paydown + projected appreciation supports a ~$46k cash-out refi (75% LTV) — recoverable capital for the next deal without selling this one.
Negotiation context
- It's been on market 53 days — a 3% lower offer ($261k) is reasonable based on typical stale-listing flexibility.
Risks & watch-outs
- Climate carrying-cost: moderate wildfire risk; extreme-heat days projected 7→18/yr by 2055 (HVAC capex compounding) — expect insurance premiums to compound above CPI over the hold.
Questions for the listing agent
- What do current leases actually rent for vs. the listed asking? Can we see a recent rent roll and the last 12 months of T-12 income?
- It's been on market 53 days. Have you received any prior offers? Is the seller open to a 32% concession, seller financing, or rate buy-down credit?
- Is there a deadline driving the sale (1031 exchange, divorce, estate, relocation)? That informs how much negotiation room exists.
- Schools are A-rated — typically a magnet for longer-tenancy family renters. What's the average tenant stay here, and is there a school-zone premium baked into asking?
- The area grade is low — what's the realistic commute time and amenity access for the typical tenant pool here? Any planned neighborhood developments (good or bad) we should know about?
- What's the average days-on-market for RENTAL listings here right now (not sales)? A rising rental-DOM trend means longer vacancies and softer asking-rent achievability than the comps imply.
- What's the recent tenant-quality profile in this submarket — average credit score on applications, eviction rate, late-payment / NSF rate, and stable-employment percentage? A property-management company in the area should have these aggregated.
- How much new for-sale + rental construction is in the pipeline within 1–3 miles? Heavy new supply typically softens prices + rents 12–24 months out; constrained supply supports both.
Investment metrics
- 1% rule
- 0.68% ✗
- Cap rate
- 4.41%
- Cash-on-cash
- -6.72%
- DSCR
- 0.70
- GRM
- 12.3
CMA / ARV
- ARV (on-the-fly)
- $268,632
- Comps found
- 12
Show comp detail 12 sales within ~0.75 mi
| Address | Dist | Beds/Ba | Sqft | Sold | Price | $/sf | Match |
|---|---|---|---|---|---|---|---|
| 6608 SW Memphis Ave | 0.00mi | 3/2.5 | 1,599 (0%) | 0mo | $268,800 | $168 | 100 |
| 3405 SW Endearment St | 0.04mi | 3/2.5 | 1,599 (0%) | 1mo | $260,000 | $163 | 98 |
| 3403 SW Endearment St | 0.03mi | 3/2.5 | 1,599 (0%) | 2mo | $259,900 | $163 | 97 |
| 6616 SW Dignity Ave | 0.10mi | 3/2.5 | 1,599 (0%) | 1mo | $265,000 | $166 | 94 |
| 6618 SW Dignity Ave | 0.10mi | 3/2.5 | 1,599 (0%) | 1mo | $264,000 | $165 | 94 |
| 6908 SW Dignity Ave | 0.07mi | 3/2.5 | 1,599 (0%) | 3mo | $270,000 | $169 | 94 |
| 6800 SW Dignity Ave | 0.10mi | 3/2.5 | 1,599 (0%) | 2mo | $267,800 | $167 | 94 |
| 6802 SW Dignity Ave | 0.11mi | 3/2.5 | 1,599 (0%) | 2mo | $267,800 | $167 | 93 |
| 6902 SW Dignity Ave | 0.15mi | 3/2.5 | 1,599 (0%) | 3mo | $268,800 | $168 | 91 |
| 6614 SW Dignity Ave | 0.10mi | 3/3.0 | 1,430 (-11%) | 1mo | $260,600 | $182 | 75 |
| 6810 SW Dignity Ave | 0.10mi | 3/3.0 | 1,430 (-11%) | 2mo | $239,900 | $168 | 74 |
| 6808 SW Dignity Ave | 0.14mi | 3/3.0 | 1,430 (-11%) | 3mo | $260,600 | $182 | 71 |
Match score weights: distance 35% · size 25% · config 20% · recency 20%. Top-matched comps best support the ARV.
Projected returns pro-forma
10.0% appreciation · 0.39% rent growth · sell at horizon
- IRR
- 18.9%
- Equity multiple
- 2.53×
- Total profit
- $114,836
- Equity at exit
- $242,005
- IRR
- 17.0%
- Equity multiple
- 5.66×
- Total profit
- $350,877
- Equity at exit
- $521,893
Cash invested: $75,217 (down + closing). Projections, not guarantees.
Landlord ↔ Tenant lean methodology
- Overall (STATE)
- 92 Strongly Landlord-Friendly
- State Arkansas
- 92 Strongly Landlord-Friendly · R+14
- County
- — inherits STATE
- City
- — inherits STATE
ZIP-level market 72713
- Home prices YoY
- 3.5%
- Rents YoY
- 0.4%
- Active inventory
- 690
- Price-to-rent
- 12.3×
Monthly cashflow live
- Estimated rent
- $1,816 high interval (Pro) →
- Mortgage (P&I)
- −$1,409
- Tax est. 1.5%
- −$336 /mo · $4,029/yr
- Insurance
- −$112
- HOA
- −$0
- Vacancy / Maint / Mgmt
- −$381
- Net cashflow
- $-422
Break-even live
UW: 25.0% down · 7.5% · 30yr · 1.5% tax · 5.0% vac · 8.0% maint · 8.0% mgmt
Financing live
Cash to close
- Down payment
- $67,158
- Closing costs
- $8,059
- Reserves months
- —
- Total cash needed
- —
Loan-product check · same deal, 3 products live
Conventional
25% down · 7.5% · 30yr
- Down + closing
- —
- Monthly P&I
- —
- Monthly cashflow
- —
- DSCR
- —
- Eligible?
- —
Personal DTI + credit; lowest rate.
DSCR
20% down · 8.5% · 30yr
- Down + closing
- —
- Monthly P&I
- —
- Monthly cashflow
- —
- DSCR
- —
- Eligible?
- —
No personal income docs; deal must DSCR.
Hard money
10% down · 12.0% · 12mo
- Down + closing
- —
- Monthly P&I
- —
- Monthly cashflow
- —
- DSCR
- —
- Eligible?
- —
Short-term bridge; refi at stabilization.
Rent comps 40 comps
| Address | Beds | Baths | Sqft | Rent | $/sqft | DOM | Units | Dist |
|---|---|---|---|---|---|---|---|---|
| 3401 SW Endearment St Bentonville, AR | 4.0 | 2.5 | 2065 | $2,000 | $0.97 | 23d | 1 | 0.01mi |
| 6812 Memphis Bentonville, AR | 3.0 | 2.5 | 1599 | $1,550 | $0.97 | 23d | 1 | 0.02mi |
| 6604 SW Dignity Ave Bentonville, AR | 3.0 | 3.0 | 1430 | $1,550 | $1.08 | 14d | 1 | 0.06mi |
| 6800 SW Dignity Ave Bentonville, AR | 3.0 | 2.5 | 1599 | $1,895 | $1.19 | 14d | 1 | 0.11mi |
| 221 Williams Ct Bentonville, AR | 3.0 | 2.0 | 1410 | $1,725 | $1.22 | 23d | 1 | 0.12mi |
| 6802 SW Dignity Ave Bentonville, AR | 3.0 | 2.5 | 1599 | $1,895 | $1.19 | 23d | 1 | 0.12mi |
| 231 Palm St Bentonville, AR | 3.0 | 2.0 | 1828 | $2,050 | $1.12 | 23d | 1 | 0.29mi |
| 4301 SW Pawhuska St Bentonville, AR | 3.0 | 2.0 | 1782 | $1,980 | $1.11 | 23d | 1 | 0.61mi |
| 621-623 Cosmos St Centerton, AR | 3.0 | 2.0 | 1475 | $1,795 | $1.22 | 14d | 1 | 0.68mi |
| 5805 SW Teppee Ave Bentonville, AR | 4.0 | 2.5 | 1854 | $2,145 | $1.16 | 23d | 1 | 0.69mi |
| 5809 SW Macasin Ave Bentonville, AR | 4.0 | 2.0 | 1745 | $2,100 | $1.20 | 23d | 1 | 0.76mi |
| 6000 SW Desert Ave Bentonville, AR | 3.0 | 2.0 | 1669 | $2,050 | $1.23 | 14d | 1 | 0.97mi |
| 831 Massachusetts Ave Bentonville, AR | 2.0 | 2.0 | 1250 | $1,718 | $1.37 | 23d | 1 | 1.10mi |
| 840 States Ave Bentonville, AR | 3.0 | 2.0 | 1100 | $1,624 | $1.48 | 23d | 1 | 1.10mi |
| 830 Massachusetts Ave Bentonville, AR | 2.0 | 2.0 | 1250 | $1,718 | $1.37 | 23d | 1 | 1.12mi |
| 860 States Ave Bentonville, AR | 2.0 | 2.0 | 1250 | $1,718 | $1.37 | 23d | 1 | 1.12mi |
| 891 States Ave Bentonville, AR | 2.0 | 2.0 | 1250 | $1,718 | $1.37 | 23d | 1 | 1.12mi |
| 841 Tennessee Ave Bentonville, AR | 2.0 | 2.5 | 1250 | $1,640 | $1.31 | 23d | 1 | 1.13mi |
| 931 States Ave Bentonville, AR | 2.0 | 2.0 | 1250 | $1,718 | $1.37 | 23d | 1 | 1.15mi |
| 890 Tennessee Ave Bentonville, AR | 3.0 | 2.5 | 1250 | $1,595 | $1.28 | 21d | 1 | 1.16mi |
| 821 Arctic Ave Bentonville, AR | 2.0 | 2.0 | 1250 | $1,726 | $1.38 | 23d | 1 | 1.17mi |
| 831 Ventnor Ave Bentonville, AR | 3.0 | 2.0 | 1100 | $1,525 | $1.39 | 23d | 1 | 1.18mi |
| 1021 States Ave Bentonville, AR | 2.0 | 2.5 | 1250 | $1,850 | $1.48 | 14d | 1 | 1.19mi |
| 830 Ventnor Ave Bentonville, AR | 2.0 | 2.5 | 1100 | $1,350 | $1.23 | 21d | 1 | 1.19mi |
| 1020 States Ave Bentonville, AR | 3.0 | 2.0 | 1100 | $1,624 | $1.48 | 23d | 1 | 1.20mi |
| 861 Ventnor Ave Bentonville, AR | 2.0 | 2.5 | 1100 | $1,350 | $1.23 | 23d | 1 | 1.20mi |
| 860 Ventnor Ave Bentonville, AR | 2.0 | 2.5 | 1100 | $1,350 | $1.23 | 23d | 1 | 1.21mi |
| 881 Ventnor Ave Centerton, AR | 3.0 | 2.5 | 1250 | $1,550 | $1.24 | 23d | 1 | 1.21mi |
| 820 Boardwalk Ave Bentonville, AR | 3.0 | 2.0 | 1100 | $1,450 | $1.32 | 23d | 1 | 1.21mi |
| 840 Boardwalk Ave Bentonville, AR | 2.0 | 2.5 | 1100 | $1,465 | $1.33 | 23d | 1 | 1.22mi |
| 1060 States Ave Bentonville, AR | 3.0 | 2.0 | 1100 | $1,624 | $1.48 | 23d | 1 | 1.22mi |
| 1031 Kentucky Ave Bentonville, AR | 3.0 | 2.0 | 1100 | $1,700 | $1.55 | 23d | 1 | 1.22mi |
| 1040 Indiana Ave Bentonville, AR | 3.0 | 2.0 | 1100 | $1,624 | $1.48 | 23d | 1 | 1.22mi |
| 1061 Indiana Ave Bentonville, AR | 3.0 | 2.0 | 1100 | $1,624 | $1.48 | 23d | 1 | 1.23mi |
| 1050 Indiana Ave Bentonville, AR | 3.0 | 2.0 | 1100 | $1,624 | $1.48 | 23d | 1 | 1.23mi |
| 1090 States Ave Bentonville, AR | 2.0 | 2.0 | 1250 | $1,718 | $1.37 | 23d | 1 | 1.24mi |
| 1061 Kentucky Ave Bentonville, AR | 3.0 | 2.5 | 1250 | $1,550 | $1.24 | 23d | 1 | 1.24mi |
| 1091 Indiana Ave Bentonville, AR | 2.0 | 2.0 | 1250 | $1,718 | $1.37 | 23d | 1 | 1.25mi |
| 1080 Indiana Ave Bentonville, AR | 3.0 | 2.0 | 1100 | $1,624 | $1.48 | 23d | 1 | 1.25mi |
| 960 Ventnor Ave Centerton, AR | 3.0 | 2.5 | 1250 | $1,750 | $1.40 | 23d | 1 | 1.27mi |
Listing history 14 events
-
2026-06-18days on market $268,800 Active 53 DOM
-
2026-06-17days on market $268,800 Active 52 DOM
-
2026-06-15days on market $268,800 Active 50 DOM
-
2026-06-14days on market $268,800 Active 48 DOM
-
2026-06-10days on market $268,800 Active 45 DOM
-
2026-06-09days on market $268,800 Active 44 DOM
-
2026-06-08days on market $268,800 Active 43 DOM
-
2026-06-07days on market $268,800 Active 42 DOM
-
2026-06-05days on market $268,800 Active 39 DOM
-
2026-06-03days on market $268,800 Active 38 DOM
-
2026-06-02days on market $268,800 Active 37 DOM
-
2026-06-01days on market $268,800 Active 36 DOM
-
2026-05-31days on market $268,800 Active 35 DOM
-
2026-05-31days on market $268,800 Active 34 DOM
ⓘ Source: listings_history table (triggers on properties + properties_extension) + one-shot
backfill from property_details.listing_events for pre-trigger history.
Climate risk First Street
- Flood 1/10 Low FEMA zone X (unshaded) · 0% chance over 30 yrs
- Wildfire 5/10 Major
- Heat 5/10 Major 7 d/yr ≥105°F today · 18 d/yr by 30 yrs out
- Wind 3/10 Moderate 5% chance of damaging wind over 30 yrs
- Air quality 1/10 Low 0 unhealthy d/yr today · 0 by 30 yrs out
Nearby sold comps map
Loading sold comps map…
Walkable amenities ~0.75 mi
Loading nearby amenities…
Taxation est. · year 1
- Rental income
- $21,797
- − Mortgage interest
- −$15,048
- − Property taxes
- −$4,029
- − Insurance
- −$1,343
- − Repairs & maintenance
- −$1,744
- − Management
- −$1,744
- − Depreciation
- −$7,815
- Taxable loss
- −$9,926
- Est. tax savings @ 24.0%
- +$2,382
- After-tax cash flow
- $-2,676/yr
For passive investors: Depreciation is non-cash, so a rental often shows a tax loss while cash-flowing — sheltering income. Rental losses are passive: they offset passive income freely, and up to $25,000/yr can offset ordinary (W-2) income if you actively participate and your MAGI is under $100k (phasing out to $0 by $150k); unused losses carry forward. On sale, claimed depreciation is recaptured at up to 25%, and gains may owe capital-gains tax (a 1031 exchange can defer both). Figures are a year-1 estimate at your 24.0% rate — not tax advice; consult a CPA.
Schools (NCES district)
- District
- Bentonville School District
- NCES district ID
- 0503060
- Math proficiency
- 59% ▼ -8.00%
- Reading proficiency
- 59% ▼ -6.00%
- Median HH income
- $66,721
- Composite
- 51.85/100
- National rank
- #1661
- State rank
- #3 of 238 in AR
Livability — Bentonville
- Score
- 83/100
- State rank
- #2
- US rank
- #864
Category grades
Schools grade is shown separately in the Schools card above.
Census & demographics
- Census place
- Bentonville, AR
- County
- Benton County · 259,241 people
- City population
- 67,689
- Metro
- Fayetteville-Springdale-Rogers, AR
- Population (ZIP)
- 28,999
- Household income
- $119,853
- Rent vs Own
- Severe rent burden
- 508.0
Population outlook (Benton County) Hauer SSP2
- Today (2025)
- 318,683 people
- By 2030
- 353,481 · +10.9%
- By 2040
- 425,280 · +33.4%
- By 2050
- 497,239 · +56.0%
- By 2075
- 662,114 · +107.8%
- By 2100
- 776,431 · +143.6%
Race, ethnicity, and origin ACS 2023
- Neighborhood character
- Diverse neighborhood (Simpson 0.66)
- Race & ethnicity
- White 54% Asian 20% Two or more races 16% Hispanic / Latino 11% Black 3%
- Hispanic origin (detail)
- Mexican 8%
- Common ancestry
- Italian 2% Slovak 2% Romanian 1%
- Foreign-born
- 22% · Canada, China, Vietnam
- Languages at home
- 79% English-only · Other Asian/Pacific 8% Spanish 6% Other Indo-European 5%
Political lean MEDSL · Benton
- 2024 margin
- Strong R (+27.0) · D 35.2% · R 62.1% · Other 2.7%
- 2008→2024 swing
- +9.6pp toward D · 2008: -36.5pp · 2024: -27.0pp
- All cycles
- 2024: R+27.0 2020: R+26.4 2016: R+34.9 2012: R+40.4 2008: R+36.5
Not yet ingested
- Civics
- —
Market trends
- HPI YoY
- ▲ 10.77%
- Current HPI
- 319.3081
- Rent YoY
- ▲ 0.39%
- Metro
- Fayetteville-Springdale-Rogers, AR
- State GDP YoY
- ▲ 3.80%
- F500 in state
- 10
Industry mix (Fortune 500 HQ in AR)
| Industry | F500 HQs | Revenue |
|---|---|---|
| Retail | 1 | $681B |
|
||
| Food / Agriculture | 1 | $53B |
|
||
| Retail / Energy | 1 | $22B |
|
||
| Transportation / Logistics | 1 | $12B |
|
||
| Energy | 1 | $4B |
|
||
Cash-flow waterfall
monthlySold comps — $/sqft
last 12 mo · ≤1 miLoading sold comps…