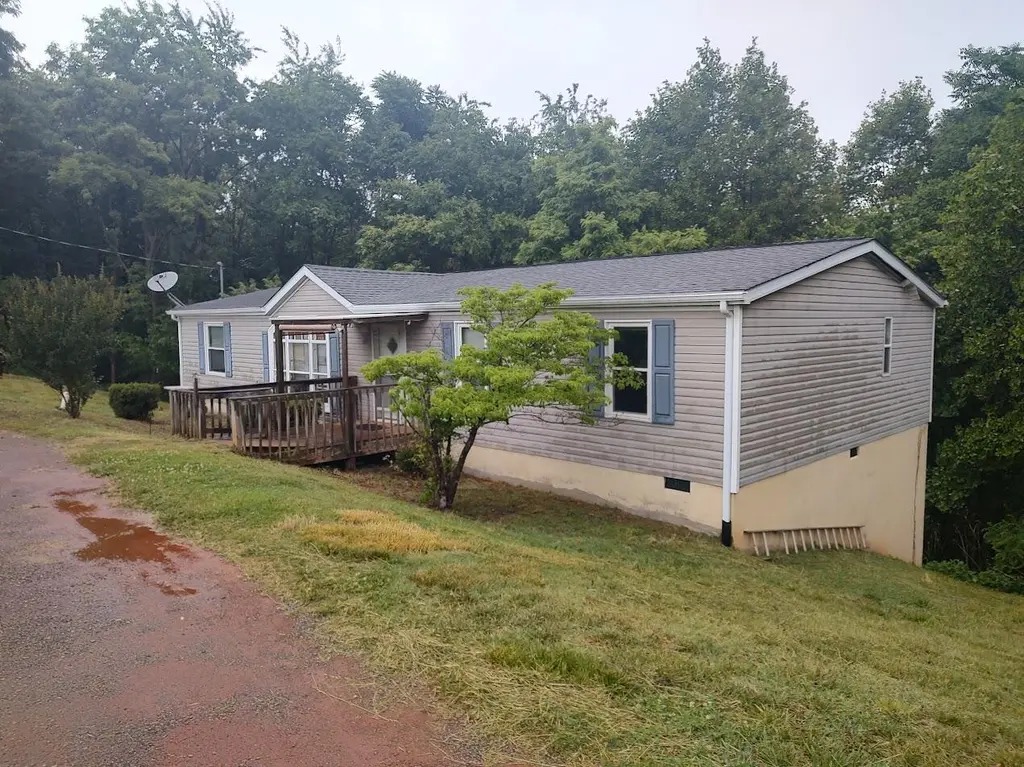
2470 Hales Ford Rd
Westlake Corner, VA 24121
$75,000B
4 bd · 2.0 ba ·
1,512 sqft ·
Built 2001
· SingleFamily
· Pending
· 3 DOM
Cashflow @ list (25.0% down · 7.5%)
Estimated rent
$2,176/mo
Mortgage (P&I)
−$393
Tax + insurance
−$80
HOA
−$0
Vac / Maint / Mgmt
−$457
Net cashflow
$1,246/mo
Annual
$14,948/yr
Cap rate
26.22%
Cash-on-cash
71.18%
DSCR
4.17
1% rule
2.90%
Cash to close
$21,000
Investor read
- This is a 4-bed/2.0-bath single-family listed at $75k.
- At list price, monthly cash flow is $1k ($15k/yr) — positive.
- The deal already cash-flows at list — no discount required.
- Meets the 1% rule at list price ($2k rent vs $75k).
- Only 3 days on market — expect competitive offers; lowballing is unlikely to land.
- Local home prices are declining (-3.0%/yr); year-one equity from $519 of loan paydown is wiped out by about $2k of value loss. Plan a longer hold.
- Location reads 54/100 on livability (#525 in VA) — a working-class tenant base; expect higher turnover. Strengths: crime A+; Watch: employment C-, cost of living D+, amenities F.
- Bedford County Public School District (rural): math 55% / reading 73% proficiency, ranked #41 of 131 in VA (top 31%) — acceptable for families but not a draw, mixed tenant base, ~2y average lease.
- Zoned schools: Goodview Elementary (math 47% / reading 57%, grade C-, #696 of 1,108 statewide, top 66%, 495 students, 70% FRL); Staunton River Middle (math 45% / reading 65%, grade B-, #189 of 342 statewide, top 56%, 627 students, 86% FRL); Staunton River High (math 39% / reading 66%, grade C-, #293 of 319 statewide, top 92%, 889 students, 69% FRL) — zoned schools average 75% FRL vs 30% district-wide (45 pts higher); higher-poverty schools than district average — tighter screening recommended.
- Market conditions: 364 active listings in the ZIP; 294 units permitted in Bedford County in 2024 (0 in 5+ unit buildings).
- Bedford County population projected at +8% by 2050 — modest demand growth; plan on rents tracking national, not racing it.
- 2 sale attempts since 17y ago with the ask held roughly flat each time — persistent listings suggest the price (not the market) is what's stuck; bring a comps-based counter.
- At projected returns (-3.0% appreciation + 3.0% rent growth), your $21k cash investment doubles in ~2 years — after that, you're playing with house money.
- Climate carrying-cost: moderate wildfire risk; extreme-heat days projected 7→18/yr by 2055 (HVAC capex compounding) — expect insurance premiums to compound above CPI over the hold.
- Cap rate 26.2% vs local median 1.5% in Westlake Corner — top-decile yield for the area; either an underpriced asset or a hidden risk that comps aren't pricing in. Stress-test before assuming the spread holds.
Questions for listing agent
- Is there a deadline driving the sale (1031 exchange, divorce, estate, relocation)? That informs how much negotiation room exists.
- Schools are F-rated, which usually means shorter tenancies and higher turnover. Who's the typical renter profile here, and what's been the actual vacancy rate?
- What's the average days-on-market for RENTAL listings here right now (not sales)? A rising rental-DOM trend means longer vacancies and softer asking-rent achievability than the comps imply.
- What's the recent tenant-quality profile in this submarket — average credit score on applications, eviction rate, late-payment / NSF rate, and stable-employment percentage? A property-management company in the area should have these aggregated.
- How much new for-sale + rental construction is in the pipeline within 1–3 miles? Heavy new supply typically softens prices + rents 12–24 months out; constrained supply supports both.
CashFlowRE · CFR-QJVVEE2WK83F5F
· Data 6 days ago
cashflowre.app · 2026-05-29