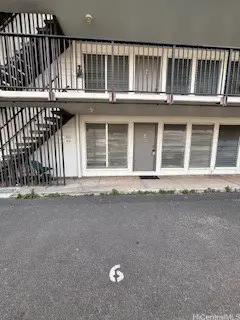
2501 Coyne St #202
Urban Honolulu, HI 96826
$310,000F
3 bd · 1.0 ba ·
925 sqft ·
Built 1970
· Condo
· Pending
· 43 DOM
Cashflow @ list (25.0% down · 7.5%)
Estimated rent
$3,159/mo
Mortgage (P&I)
−$1,626
Tax + insurance
−$244
HOA
−$1,530
Vac / Maint / Mgmt
−$663
Net cashflow
$-904/mo
Annual
$-10,849/yr
Cap rate
2.79%
Cash-on-cash
-12.50%
DSCR
0.44
1% rule
1.02%
Cash to close
$86,800
Investor read
- This is a 3-bed/1.0-bath condo listed at $310k.
- At list price, monthly cash flow is $-904 ($-11k/yr) — negative.
- To cash-flow at today's rent, offer at most $150k (51.5% below list).
- Meets the 1% rule at list price ($3k rent vs $310k).
- It's been on market 43 days — a 3% lower offer ($301k) is reasonable based on typical stale-listing flexibility.
- Recommended offer: $150k (51.5% below list) — sets the bar for cash-flow.
- Local home prices are declining (-1.0%/yr); year-one equity from $2k of loan paydown is wiped out by about $3k of value loss. Plan a longer hold.
- Location reads: area grade F — affects rentability + tenant quality, not the cash-flow math above.
- Hawaii Department Of Education (suburban): math 32% / reading 50% proficiency, ranked #1 of 1 in HI (top 100%) — families likely to look elsewhere, expect single-tenant / working-renter base with shorter leases.
- Watch-outs: HOA is 48% of rent.
- Market conditions: Rents rising (+3.5%/yr); 161 active listings in the ZIP; 40 comparable units currently listed for rent nearby; rentals at typical pace (median 18d on market — plan ~3-4 weeks tenant-placement turnaround); 1,638 units permitted in Honolulu County in 2024 (793 in 5+ unit buildings).
- Honolulu County population projected at +17% by 2050 — long-run rental-demand tailwind backs the buy-and-hold thesis.
- 2 sale attempts since 21y ago with the ask held roughly flat each time — persistent listings suggest the price (not the market) is what's stuck; bring a comps-based counter.
- Current owner paid $67k; list at $310k implies a 364% gain — meaningful room to come down on a strong offer.
- Climate carrying-cost: moderate flood risk — expect insurance premiums to compound above CPI over the hold.
- Cap rate 2.8% vs local median 1.5% in Urban Honolulu — top-decile yield for the area; either an underpriced asset or a hidden risk that comps aren't pricing in. Stress-test before assuming the spread holds.
- At $3,159/mo this rent would consume 56% of the median local household income ($68k/yr) (locally 2466% of renters already pay >50% of income on rent) — very limited rent-growth headroom before tenants either downsize or default.
Questions for listing agent
- What do current leases actually rent for vs. the listed asking? Can we see a recent rent roll and the last 12 months of T-12 income?
- It's been on market 43 days. Have you received any prior offers? Is the seller open to a 52% concession, seller financing, or rate buy-down credit?
- Built in 1970 — when were the roof, HVAC, electrical panel, plumbing, and water heater last replaced?
- What does the HOA fee cover, when was the last increase, and are there any pending special assessments or reserve-fund shortfalls?
- Any open or pending special assessments — roof, HVAC, plumbing, elevator, façade? What's the per-unit balance and payoff schedule, and is the seller paying it off at close or rolling it to the buyer?
- Is there a deadline driving the sale (1031 exchange, divorce, estate, relocation)? That informs how much negotiation room exists.
- The area grade is low — what's the realistic commute time and amenity access for the typical tenant pool here? Any planned neighborhood developments (good or bad) we should know about?
- What's the average days-on-market for RENTAL listings here right now (not sales)? A rising rental-DOM trend means longer vacancies and softer asking-rent achievability than the comps imply.
CashFlowRE · CFR-QK95AE8WSG9DAQ
· Data 3 weeks ago
cashflowre.app · 2026-05-29