2501 Coyne St #202 · Urban Honolulu, HI
Flood risk 5/10 · Moderate
- FEMA flood zone
- X (unshaded)
- Chance of flooding over 30 yrs
- 0.5%
- Est. flood insurance / yr
- $507 – $1,088
Fire risk No data
- Est. fire insurance / yr
- —
Heat risk No data
- Hot days now (above threshold)
- —
- Hot days in 30 yrs
- —
Wind risk No data
- Chance of severe wind over 30 yrs
- —
Air-quality risk 1/10 · Minimal
- Unhealthy air days now
- —
- Unhealthy air days in 30 yrs
- —
Risk factors via First Street. Map © Google.
Why this score? — see what drove the F grade
The composite is a weighted blend of 9 inputs, each scored 0–100. Each bar is that input's sub-score; the figure is the points it added to the 100-point composite (weight × sub-score).
- ARV discount +7.5/15.0
- 1% rule +5.2/10.0
- Appreciation +4.5/10.0
- Cash flow +3.7/30.0
- Schools +3.7/10.0
- Rent growth +3.4/5.0
- Livability +2.5/5.0
- Condition / age +2.5/5.0
- DSCR +0.0/10.0
$310,000
🖨 Deal sheet 📄 Offer letter ✓ Due diligence
Listing remarks MLS
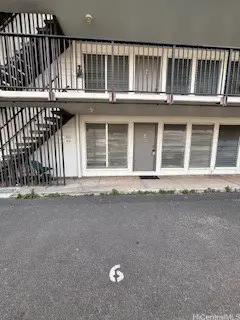
Great price. Your blank slate, original unit clean and ready for your personal touches. Great location, bus, shopping, schools, Waikiki all mere minutes away. Parking stall below unit and next to stairway. Priced to sell. Note Maintenance Fees include HOA: $1,106.77; special assessment (until 12/27) $235.89; and Reserve Contribution $187.82.
Key facts
- Great location
- Original unit
- Parking stall
Tags
Neighborhood map
What this means for you Summary
Snapshot
- This is a 3-bed/1.0-bath condo listed at $310k.
Deal economics
- At list price, monthly cash flow is $-904 ($-11k/yr) — negative.
- To cash-flow at today's rent, offer at most $150k (51.5% below list).
- Meets the 1% rule at list price ($3k rent vs $310k).
- Recommended offer: $150k (51.5% below list) — sets the bar for cash-flow.
- Cap rate 2.8% vs local median 1.5% in Urban Honolulu — top-decile yield for the area; either an underpriced asset or a hidden risk that comps aren't pricing in. Stress-test before assuming the spread holds.
Location & tenants
- Location reads: area grade F — affects rentability + tenant quality, not the cash-flow math above.
- Hawaii Department Of Education (suburban): math 32% / reading 50% proficiency, ranked #1 of 1 in HI (top 100%) — families likely to look elsewhere, expect single-tenant / working-renter base with shorter leases.
- Market conditions: Rents rising (+3.5%/yr); 161 active listings in the ZIP; 40 comparable units currently listed for rent nearby; rentals at typical pace (median 17d on market — plan ~3-4 weeks tenant-placement turnaround); 1,638 units permitted in Honolulu County in 2024 (793 in 5+ unit buildings).
- At $3,159/mo this rent would consume 56% of the median local household income ($68k/yr) (locally 2466% of renters already pay >50% of income on rent) — very limited rent-growth headroom before tenants either downsize or default.
Forward outlook
- Local home prices are declining (-1.0%/yr); year-one equity from $2k of loan paydown is wiped out by about $3k of value loss. Plan a longer hold.
- Honolulu County population projected at +17% by 2050 — long-run rental-demand tailwind backs the buy-and-hold thesis.
Negotiation context
- It's been on market 43 days — a 3% lower offer ($301k) is reasonable based on typical stale-listing flexibility.
- 2 sale attempts since 21y ago with the ask held roughly flat each time — persistent listings suggest the price (not the market) is what's stuck; bring a comps-based counter.
- Current owner paid $67k; list at $310k implies a 364% gain — meaningful room to come down on a strong offer.
Risks & watch-outs
- Watch-outs: HOA is 48% of rent.
- Climate carrying-cost: moderate flood risk — expect insurance premiums to compound above CPI over the hold.
Questions for the listing agent
- What do current leases actually rent for vs. the listed asking? Can we see a recent rent roll and the last 12 months of T-12 income?
- It's been on market 43 days. Have you received any prior offers? Is the seller open to a 52% concession, seller financing, or rate buy-down credit?
- Built in 1970 — when were the roof, HVAC, electrical panel, plumbing, and water heater last replaced?
- What does the HOA fee cover, when was the last increase, and are there any pending special assessments or reserve-fund shortfalls?
- Any open or pending special assessments — roof, HVAC, plumbing, elevator, façade? What's the per-unit balance and payoff schedule, and is the seller paying it off at close or rolling it to the buyer?
- Is there a deadline driving the sale (1031 exchange, divorce, estate, relocation)? That informs how much negotiation room exists.
- The area grade is low — what's the realistic commute time and amenity access for the typical tenant pool here? Any planned neighborhood developments (good or bad) we should know about?
- What's the average days-on-market for RENTAL listings here right now (not sales)? A rising rental-DOM trend means longer vacancies and softer asking-rent achievability than the comps imply.
- What's the recent tenant-quality profile in this submarket — average credit score on applications, eviction rate, late-payment / NSF rate, and stable-employment percentage? A property-management company in the area should have these aggregated.
- How much new apartment / multifamily construction is in the pipeline within 1–3 miles? Heavy new supply (>2% of stock underway) typically softens rents 12–24 months out; light construction supports rent growth.
Investment metrics
- 1% rule
- 1.02% ✓
- Cap rate
- 2.79%
- Cash-on-cash
- -12.50%
- DSCR
- 0.44
- GRM
- 8.2
CMA / ARV
No comps found within radius.
Projected returns pro-forma
-1.0% appreciation · 3.55% rent growth · sell at horizon
- IRR
- -21.4%
- Equity multiple
- 0.10×
- Total profit
- $-78,415
- Equity at exit
- $74,757
- IRR
- -13.7%
- Equity multiple
- -0.23×
- Total profit
- $-106,624
- Equity at exit
- $78,438
Cash invested: $86,800 (down + closing). Projections, not guarantees.
Landlord ↔ Tenant lean methodology
- Overall (STATE)
- 37 Tenant-Leaning
- State Hawaii
- 37 Tenant-Leaning · D+13
- County
- — inherits STATE
- City
- — inherits STATE
ZIP-level market 96826
- Home prices YoY
- -0.4%
- Rents YoY
- 3.5%
- Active inventory
- 161
- Price-to-rent
- 8.2×
Monthly cashflow live
- Estimated rent
- $3,159 high interval (Pro) →
- Mortgage (P&I)
- −$1,626
- Tax from tax record
- −$115 /mo · $1,377/yr
- Insurance
- −$129
- HOA
- −$1,530
- Vacancy / Maint / Mgmt
- −$663
- Net cashflow
- $-904
Break-even live
UW: 25.0% down · 7.5% · 30yr · 1.5% tax · 5.0% vac · 8.0% maint · 8.0% mgmt
Financing live
Cash to close
- Down payment
- $77,500
- Closing costs
- $9,300
- Reserves months
- —
- Total cash needed
- —
Loan-product check · same deal, 3 products live
Conventional
25% down · 7.5% · 30yr
- Down + closing
- —
- Monthly P&I
- —
- Monthly cashflow
- —
- DSCR
- —
- Eligible?
- —
Personal DTI + credit; lowest rate.
DSCR
20% down · 8.5% · 30yr
- Down + closing
- —
- Monthly P&I
- —
- Monthly cashflow
- —
- DSCR
- —
- Eligible?
- —
No personal income docs; deal must DSCR.
Hard money
10% down · 12.0% · 12mo
- Down + closing
- —
- Monthly P&I
- —
- Monthly cashflow
- —
- DSCR
- —
- Eligible?
- —
Short-term bridge; refi at stabilization.
Rent comps 40 comps
| Address | Beds | Baths | Sqft | Rent | $/sqft | DOM | Units | Dist |
|---|---|---|---|---|---|---|---|---|
| 902 University Ave Unit C Honolulu, HI | 2.0 | 1.0 | 415 | $2,735 | $6.58 | 23d | 1 | 0.19mi |
| 2724 Kahoaloha Ln Honolulu, HI | 2.0 | 2.0 | 939 | $2,998 | $3.19 | 23d | 2 | 0.32mi |
| 2440 Date St #901 Honolulu, HI | 3.0 | 1.5 | 918 | $2,600 | $2.83 | 17d | 1 | 0.38mi |
| 2474 Kapiolani Blvd #401 Honolulu, HI | 2.0 | 2.0 | 793 | $3,100 | $3.91 | 23d | 1 | 0.44mi |
| 2474 Kapiolani Blvd #401 Honolulu, HI | 2.0 | 2.0 | 793 | $3,100 | $3.91 | 3d | 1 | 0.44mi |
| 2011 Waiola St Honolulu, HI | 3.0 | 2.0 | 800 | $3,100 | $3.88 | 21d | 1 | 0.49mi |
| 2499 Kapiolani Blvd Honolulu, HI | 1.0–2.0 | 1.0–1.5 | 575 | $3,300 | $5.74 | 10d | 2 | 0.49mi |
| 2499 Kapiolani Blvd #1408 Honolulu, HI | 2.0 | 2.0 | 947 | $3,750 | $3.96 | 44d | 1 | 0.50mi |
| 2499 Kapiolani Blvd #3800 Honolulu, HI | 2.0 | 1.5 | 676 | $3,200 | $4.73 | 3d | 1 | 0.50mi |
| 2333 Kapiolani Blvd Unit 1008B Honolulu, HI | 2.0 | 1.0 | 600 | $2,700 | $4.50 | 23d | 1 | 0.56mi |
| 2333 Kapiolani Blvd #810 Honolulu, HI | 2.0 | 2.0 | 831 | $3,200 | $3.85 | 14d | 1 | 0.56mi |
| 500 University Ave Honolulu, HI | 1.0–2.0 | 1.0–2.5 | 826 | $3,200 | $3.87 | 12d | 3 | 0.56mi |
| 500 University Ave Honolulu, HI | 2.0 | 2.5 | 1120 | $3,150 | $2.81 | 10d | 2 | 0.56mi |
| 2333 Kapiolani Blvd Honolulu, HI | 2.0 | 2.0 | 827 | $3,050 | $3.69 | 16d | 2 | 0.57mi |
| 2014 Fern St Honolulu, HI | 3.0 | 2.0 | 983 | $3,000 | $3.05 | 23d | 1 | 0.57mi |
| 2121 Ala Wai Blvd Honolulu, HI | 2.0 | 1.0–3.0 | 1006 | $4,200 | $4.17 | 21d | 2 | 0.80mi |
| 2121 Ala Wai Blvd Honolulu, HI | 2.0 | 1.0–3.0 | 1006 | $4,150 | $4.12 | 3d | 2 | 0.80mi |
| 2121 Ala Wai Blvd Honolulu, HI | 2.0 | 1.0–3.0 | 1006 | $4,400 | $4.37 | 10d | 1 | 0.80mi |
| 430 Keoniana St Honolulu, HI | 2.0 | 2.0 | 887 | $2,900 | $3.27 | 23d | 1 | 0.83mi |
| 421 Olohana St #2003 Honolulu, HI | 2.0 | 2.0 | 1023 | $4,200 | $4.11 | 3d | 1 | 0.83mi |
| 910 Kapahulu Ave #703 Honolulu, HI | 2.0 | 1.0 | 739 | $2,600 | $3.52 | 11d | 1 | 0.83mi |
| 1750 Kalakaua Ave #2704 Honolulu, HI | 2.0 | 2.0 | 1065 | $3,300 | $3.10 | 23d | 1 | 0.84mi |
| 1837 Kalakaua Ave Honolulu, HI | 2.0 | 2.0 | 1004 | $4,850 | $4.83 | 3d | 3 | 0.86mi |
| 3046C Harding Ave Honolulu, HI | 3.0 | 1.0 | 632 | $2,800 | $4.43 | 23d | 1 | 0.87mi |
| 3046 Harding Ave Unit C Honolulu, HI | 3.0 | 1.0 | 608 | $2,800 | $4.61 | 23d | 1 | 0.87mi |
| 1114 Punahou St Unit 9A Honolulu, HI | 3.0 | 2.0 | 1037 | $3,600 | $3.47 | 17d | 1 | 0.88mi |
| 469 Ena Rd Honolulu, HI | 2.0–3.0 | 2.0–3.0 | 1098 | $3,950 | $3.60 | 3d | 4 | 0.89mi |
| 469 Ena Rd Honolulu, HI | 2.0–3.0 | 2.0–3.0 | 1098 | $4,000 | $3.64 | 17d | 3 | 0.89mi |
| 1717 Ala Wai Blvd Honolulu, HI | 2.0 | 2.0 | 922 | $3,350 | $3.63 | 44d | 1 | 0.90mi |
| 2281 Ala Wai Blvd #902 Honolulu, HI | 2.0 | 1.0 | 609 | $3,950 | $6.49 | 14d | 1 | 0.90mi |
| 3138 Waialae Ave #609 Honolulu, HI | 2.0 | 2.0 | 802 | $2,995 | $3.73 | 3d | 1 | 0.91mi |
| 3138 Waialae Ave #608 Honolulu, HI | 2.0 | 2.0 | 959 | $3,000 | $3.13 | 23d | 1 | 0.91mi |
| 1717 Ala Wai Blvd Honolulu, HI | 2.0–3.0 | 2.0 | 1026 | $3,500 | $3.41 | 3d | 2 | 0.91mi |
| 730 Makaleka Ave #501 Honolulu, HI | 3.0 | 2.0 | 952 | $3,000 | $3.15 | 23d | 1 | 0.96mi |
| 451 Nahua St Honolulu, HI | 2.0 | 1.0 | 786 | $2,895 | $3.68 | 23d | 1 | 0.96mi |
| 2916 Date St Honolulu, HI | 2.0 | 2.0 | 803 | $2,925 | $3.64 | 10d | 2 | 0.96mi |
| 2916 Date St Unit 18D Honolulu, HI | 2.0 | 2.0 | 817 | $3,200 | $3.92 | 20d | 1 | 0.97mi |
| 1314 Kalakaua Ave Honolulu, HI | 2.0 | 1.0–2.0 | 802 | $4,900 | $6.11 | 3d | 2 | 0.97mi |
| 1314 Kalakaua Ave Honolulu, HI | 2.0 | 1.0–2.0 | 773 | $4,675 | $6.04 | 23d | 3 | 0.97mi |
| 1314 Kalakaua Ave #1202 Honolulu, HI | 2.0 | 2.0 | 832 | $5,000 | $6.01 | 20d | 1 | 0.98mi |
HOA detail condo
- Monthly dues
- $1,530 · $18,360/yr
- ⚠ Special-assessment mentions
-
…away. Parking stall below unit and next to stairway. Priced to sell. Note Maintenance Fees include HOA: $1,106.77; special assessment (until 12/27) $235.89; and Reserve Contribution $187.82.
Listing history 7 events
-
2026-05-10status Pending 343-char remark
Show marketing remark (343 chars)
Great price. Your blank slate, original unit clean and ready for your personal touches. Great location, bus, shopping, schools, Waikiki all mere minutes away. Parking stall below unit and next to stairway. Priced to sell. Note Maintenance Fees include HOA: $1,106.77; special assessment (until 12/27) $235.89; and Reserve Contribution $187.82.
-
2026-03-26$310,000 Active 343-char remark
Show marketing remark (343 chars)
Great price. Your blank slate, original unit clean and ready for your personal touches. Great location, bus, shopping, schools, Waikiki all mere minutes away. Parking stall below unit and next to stairway. Priced to sell. Note Maintenance Fees include HOA: $1,106.77; special assessment (until 12/27) $235.89; and Reserve Contribution $187.82.
-
2005-12-30soldstatus $66,800
-
2005-09-30soldstatus $265,000 195-char remark
Show marketing remark (195 chars)
Roomy 3 bdrm unit with 925 sf of living aea in great condition with new carpets & fresh paint! Excellent in-town location near UH is close to bus, shopping, schools! Fee Available at $66,800.
-
2005-09-30soldstatus $265,000
Show marketing remark (195 chars)
Roomy 3 bdrm unit with 925 sf of living aea in great condition with new carpets & fresh paint! Excellent in-town location near UH is close to bus, shopping, schools! Fee Available at $66,800.
-
2005-08-10$265,000 195-char remark
Show marketing remark (195 chars)
Roomy 3 bdrm unit with 925 sf of living aea in great condition with new carpets & fresh paint! Excellent in-town location near UH is close to bus, shopping, schools! Fee Available at $66,800.
-
1976-11-01soldstatus $49,900
ⓘ Source: listings_history table (triggers on properties + properties_extension) + one-shot
backfill from property_details.listing_events for pre-trigger history.
Tax reassessment forecast HI · Partial reset (capped growth)
- Current annual tax
- $1,377 · $115/mo
- Projected year-2 tax
- $1,377 · $115/mo
- Expected delta
- $0/yr ($0/mo · 0.0%)
ⓘ Screening estimate from a state-policy table — verify with the county assessor before closing.
Climate risk First Street
- Flood 5/10 Major FEMA zone X (unshaded) · 50% chance over 30 yrs
- Air quality 1/10 Low
Nearby sold comps map
Loading sold comps map…
Walkable amenities ~0.75 mi
Loading nearby amenities…
Taxation est. · year 1
- Rental income
- $37,906
- − Mortgage interest
- −$17,365
- − Property taxes
- −$1,377
- − Insurance
- −$1,550
- − Repairs & maintenance
- −$3,033
- − Management
- −$3,033
- − HOA
- −$18,360
- − Depreciation
- −$9,018
- Taxable loss
- −$15,829
- Est. tax savings @ 24.0%
- +$3,799
- After-tax cash flow
- $-7,050/yr
For passive investors: Depreciation is non-cash, so a rental often shows a tax loss while cash-flowing — sheltering income. Rental losses are passive: they offset passive income freely, and up to $25,000/yr can offset ordinary (W-2) income if you actively participate and your MAGI is under $100k (phasing out to $0 by $150k); unused losses carry forward. On sale, claimed depreciation is recaptured at up to 25%, and gains may owe capital-gains tax (a 1031 exchange can defer both). Figures are a year-1 estimate at your 24.0% rate — not tax advice; consult a CPA.
Schools (NCES district)
- District
- Hawaii Department Of Education
- NCES district ID
- 1500030
- Math proficiency
- 32% ▼ -10.00%
- Reading proficiency
- 50% ▼ -3.00%
- Median HH income
- $69,005
- Composite
- 37.07/100
- National rank
- #4504
- State rank
- #1 of 1 in HI
Livability — Urban Honolulu
No livability data for this city. (Only ~50 U.S. cities are tracked.)
Census & demographics
- Census place
- Urban Honolulu, HI
- County
- Honolulu County · 963,448 people
- City population
- 309,956
- Metro
- Urban Honolulu, HI
- Population (ZIP)
- 29,174
- Household income
- $68,296
- Rent vs Own
- Severe rent burden
- 2466.0
Population outlook (Honolulu County) Hauer SSP2
- Today (2025)
- 1,072,641 people
- By 2030
- 1,110,460 · +3.5%
- By 2040
- 1,181,593 · +10.2%
- By 2050
- 1,257,584 · +17.2%
- By 2075
- 1,501,120 · +39.9%
- By 2100
- 1,764,430 · +64.5%
Race, ethnicity, and origin ACS 2023
- Neighborhood character
- Diverse neighborhood (Simpson 0.69)
- Race & ethnicity
- Asian 54% Two or more races 18% White 13% Pacific Islander 10% Hispanic / Latino 6% Black 2%
- Hispanic origin (detail)
- Mexican 3% Puerto Rican 2%
- Common ancestry
- Russian 1% Lithuanian 1% Serbian 1%
- Foreign-born
- 30% · Vietnam, China, South Korea
- Languages at home
- 63% English-only · Other Asian/Pacific 13% Chinese 6% Vietnamese 6%
Political lean MEDSL · Honolulu
- 2024 margin
- Strong D (+21.6) · D 59.9% · R 38.3% · Other 1.8%
- 2008→2024 swing
- -19.4pp toward R · 2008: 41.1pp · 2024: 21.6pp
- All cycles
- 2024: D+21.6 2020: D+26.9 2016: D+29.9 2012: D+39.1 2008: D+41.1
Not yet ingested
- Civics
- —
Market trends
- HPI YoY
- ▼ -1.00%
- Current HPI
- 272.9183
- Rent YoY
- ▲ 3.55%
- Metro
- Urban Honolulu, HI
- State GDP YoY
- —
- F500 in state
- 0
Price history
+521.2% since first listed7 events — show timeline
- 2026-05-10 Pending — HiCentral MLS
- 2026-03-26 Listed $310,000 HiCentral MLS
- 2005-12-30 Sold (Public Records) $66,800 Public Records
- 2005-09-30 Sold (Public Records) $265,000 Public Records
- 2005-09-30 Sold (MLS) $265,000 HiCentral MLS
- 2005-08-10 Listed $265,000 HiCentral MLS
- 1976-11-01 Sold (Public Records) $49,900 Public Records
Property tax history
+2.6%/yrLatest (2022): $1,377 · +8.9% YoY. Source: county tax records.
Cash-flow waterfall
monthlySold comps — $/sqft
last 12 mo · ≤1 miLoading sold comps…