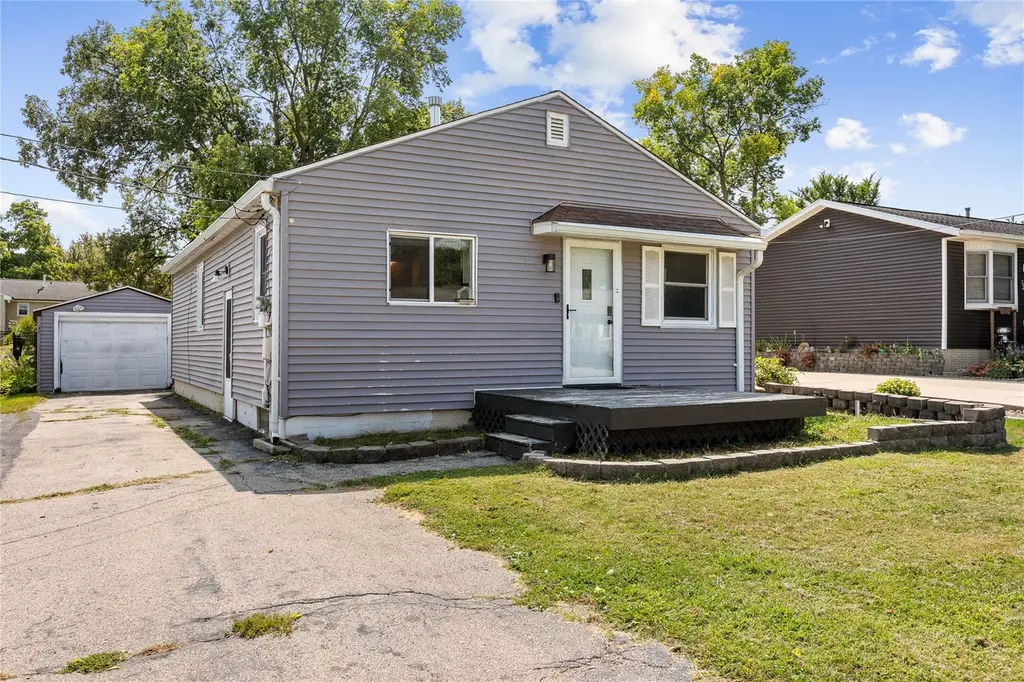
1231 33rd St St NE
Cedar Rapids, IA 52402
$142,500D
1 bd · 1.0 ba ·
1,360 sqft ·
Built 1951
· SingleFamily
· Pending
· 43 DOM
Cashflow @ list (25.0% down · 7.5%)
Estimated rent
$967/mo
Mortgage (P&I)
−$747
Tax + insurance
−$233
HOA
−$0
Vac / Maint / Mgmt
−$203
Net cashflow
$-216/mo
Annual
$-2,595/yr
Cap rate
4.47%
Cash-on-cash
-6.50%
DSCR
0.71
1% rule
0.68%
Cash to close
$39,900
Investor read
- This is a 1-bed/1.0-bath single-family listed at $142k.
- At list price, monthly cash flow is $-216 ($-3k/yr) — negative.
- To cash-flow at today's rent, offer at most $104k (26.8% below list).
- To meet the 1% rule (rent ≥ 1% of price), the offer needs to be $97k (32.1% below list).
- It's been on market 43 days — a 3% lower offer ($138k) is reasonable based on typical stale-listing flexibility.
- Recommended offer: $97k (32.1% below list) — sets the bar for 1% rule.
- Local home prices are declining (-3.0%/yr); year-one equity from $985 of loan paydown is wiped out by about $4k of value loss. Plan a longer hold.
- Location reads 78/100 on livability (#134 in IA, #2,474 nationally) — a middle-class / working-renter tenant base. Strengths: cost of living A+, housing A+, health & safety A+; Watch: crime C-, commute F.
- Cedar Rapids Community School District (urban): math 50% / reading 59% proficiency, ranked #265 of 289 in IA (top 92%) — acceptable for families but not a draw, mixed tenant base, ~2y average lease.
- Watch-outs: built in 1951 — expect roof / HVAC / electrical / plumbing capex.
- Market conditions: Rents rising fast (+11.0%/yr); 286 active listings in the ZIP; 4 comparable units currently listed for rent nearby; rentals lingering (median 45d on market — plan ~5-8 weeks vacancy on turnover, expect pricing pressure); 50% of comp listings sitting > 30 days — soft ceiling on asking rent; 1,023 units permitted in Linn County in 2024 (456 in 5+ unit buildings).
- Linn County population projected at +16% by 2050 — long-run rental-demand tailwind backs the buy-and-hold thesis.
- 3 sale attempts since 5y ago; this cycle's ask has dropped $8k (5%) from the opening price — seller is motivated, your offer sets the floor, not the list.
- Cap rate 4.5% vs local median 3.5% in Cedar Rapids — meaningfully above typical; check what's discounted (condition, days-on-market, listing class) to confirm the premium yield is real.
- This rent is only 16% of the median local income ($73k/yr) — well below the 30% rent-burden line; pricing power to push rent on renewal without tenant pushback.
Questions for listing agent
- What do current leases actually rent for vs. the listed asking? Can we see a recent rent roll and the last 12 months of T-12 income?
- It's been on market 43 days. Have you received any prior offers? Is the seller open to a 32% concession, seller financing, or rate buy-down credit?
- Built in 1951 — when were the roof, HVAC, electrical panel, plumbing, and water heater last replaced?
- Is there a deadline driving the sale (1031 exchange, divorce, estate, relocation)? That informs how much negotiation room exists.
- Schools are B-rated — typically a magnet for longer-tenancy family renters. What's the average tenant stay here, and is there a school-zone premium baked into asking?
- The area grade is low — what's the realistic commute time and amenity access for the typical tenant pool here? Any planned neighborhood developments (good or bad) we should know about?
- What's the average days-on-market for RENTAL listings here right now (not sales)? A rising rental-DOM trend means longer vacancies and softer asking-rent achievability than the comps imply.
- What's the recent tenant-quality profile in this submarket — average credit score on applications, eviction rate, late-payment / NSF rate, and stable-employment percentage? A property-management company in the area should have these aggregated.
CashFlowRE · CFR-QKPJ2YBZ2WPGFF
· Data 2 weeks ago
cashflowre.app · 2026-05-29