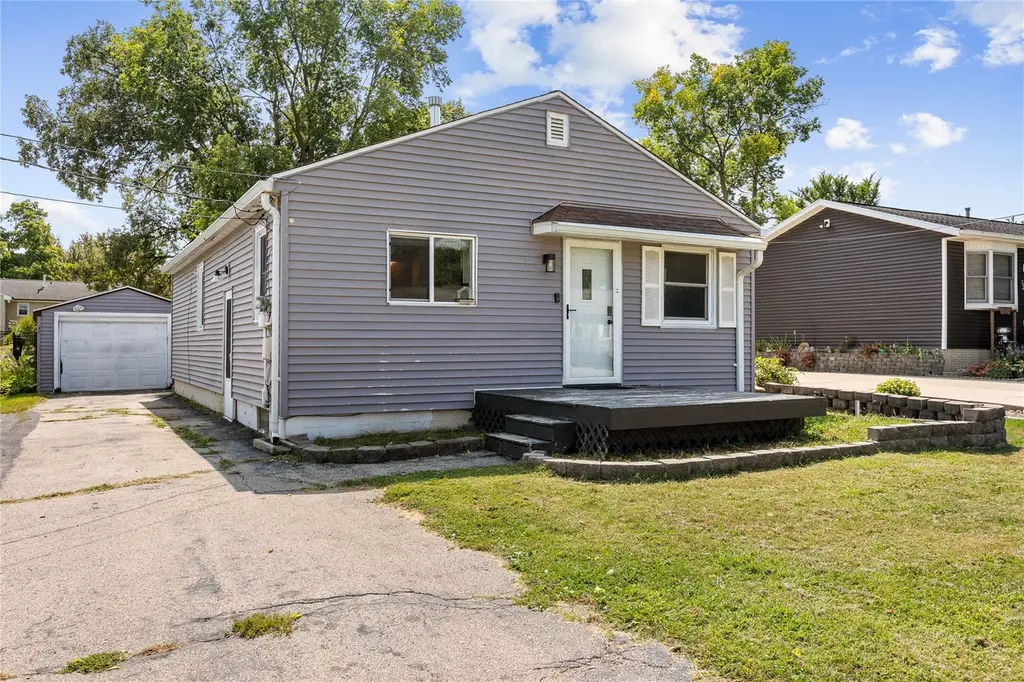
1231 33rd St St NE · Cedar Rapids, IA
Flood risk 1/10 · Minimal
- FEMA flood zone
- X (unshaded)
- Chance of flooding over 30 yrs
- 0.0%
- Est. flood insurance / yr
- $473 – $860
Fire risk 1/10 · Minimal
- Est. fire insurance / yr
- $902 – $1,676
Heat risk 3/10 · Minor
- Hot days now (above 104°F)
- 7 days/yr
- Hot days in 30 yrs
- 15 days/yr
Wind risk 2/10 · Minimal
- Chance of severe wind over 30 yrs
- —
Air-quality risk 2/10 · Minimal
- Unhealthy air days now
- 0 days/yr
- Unhealthy air days in 30 yrs
- 1 days/yr
Risk factors via First Street. Map © Google.
Why this score? — see what drove the D grade
The composite is a weighted blend of 9 inputs, each scored 0–100. Each bar is that input's sub-score; the figure is the points it added to the 100-point composite (weight × sub-score).
- ARV discount +15.0/15.0
- Cash flow +6.9/30.0
- Rent growth +5.0/5.0
- Schools +4.7/10.0
- Livability +3.9/5.0
- Condition / age +2.5/5.0
- 1% rule +1.8/10.0
- DSCR +1.1/10.0
- Appreciation +0.0/10.0
$142,500
🖨 Deal sheet 📄 Offer letter ✓ Due diligence
Listing remarks MLS
Looking for a home that blends comfort, style, and convenience? This charming 2-bedroom, 1-bath home offers an open and inviting layout with thoughtful updates throughout. Enjoy a bright and spacious living area that flows seamlessly into the dining space and a trendy, functional kitchen—perfect for everyday living and entertaining. Step outside through the sliding glass doors to a fully fenced backyard—ideal for pets, relaxing evenings, or hosting friends around a fire pit. Located just minutes from bike trails, grocery stores, and quick interstate access! Property is being sold as is. Schedule your showing today!
Key facts
- Grocery stores
- Thoughtful updates
- Bike trails
Tags
Neighborhood map
What this means for you Summary
Snapshot
- This is a 1-bed/1.0-bath single-family listed at $142k.
Deal economics
- At list price, monthly cash flow is $-216 ($-3k/yr) — negative.
- To cash-flow at today's rent, offer at most $104k (26.8% below list).
- To meet the 1% rule (rent ≥ 1% of price), the offer needs to be $97k (32.1% below list).
- Recommended offer: $97k (32.1% below list) — sets the bar for 1% rule.
- Cap rate 4.5% vs local median 3.5% in Cedar Rapids — meaningfully above typical; check what's discounted (condition, days-on-market, listing class) to confirm the premium yield is real.
Location & tenants
- Location reads 78/100 on livability (#134 in IA, #2,474 nationally) — a middle-class / working-renter tenant base. Strengths: cost of living A+, housing A+, health & safety A+; Watch: crime C-, commute F.
- Cedar Rapids Community School District (urban): math 50% / reading 59% proficiency, ranked #265 of 289 in IA (top 92%) — acceptable for families but not a draw, mixed tenant base, ~2y average lease.
- Market conditions: Rents rising fast (+11.0%/yr); 286 active listings in the ZIP; 4 comparable units currently listed for rent nearby; rentals lingering (median 44d on market — plan ~5-8 weeks vacancy on turnover, expect pricing pressure); 50% of comp listings sitting > 30 days — soft ceiling on asking rent; 1,023 units permitted in Linn County in 2024 (456 in 5+ unit buildings).
- This rent is only 16% of the median local income ($73k/yr) — well below the 30% rent-burden line; pricing power to push rent on renewal without tenant pushback.
Forward outlook
- Local home prices are declining (-3.0%/yr); year-one equity from $985 of loan paydown is wiped out by about $4k of value loss. Plan a longer hold.
- Linn County population projected at +16% by 2050 — long-run rental-demand tailwind backs the buy-and-hold thesis.
Negotiation context
- It's been on market 43 days — a 3% lower offer ($138k) is reasonable based on typical stale-listing flexibility.
- 3 sale attempts since 5y ago; this cycle's ask has dropped $8k (5%) from the opening price — seller is motivated, your offer sets the floor, not the list.
Risks & watch-outs
- Watch-outs: built in 1951 — expect roof / HVAC / electrical / plumbing capex.
Questions for the listing agent
- What do current leases actually rent for vs. the listed asking? Can we see a recent rent roll and the last 12 months of T-12 income?
- It's been on market 43 days. Have you received any prior offers? Is the seller open to a 32% concession, seller financing, or rate buy-down credit?
- Built in 1951 — when were the roof, HVAC, electrical panel, plumbing, and water heater last replaced?
- Is there a deadline driving the sale (1031 exchange, divorce, estate, relocation)? That informs how much negotiation room exists.
- Schools are B-rated — typically a magnet for longer-tenancy family renters. What's the average tenant stay here, and is there a school-zone premium baked into asking?
- The area grade is low — what's the realistic commute time and amenity access for the typical tenant pool here? Any planned neighborhood developments (good or bad) we should know about?
- What's the average days-on-market for RENTAL listings here right now (not sales)? A rising rental-DOM trend means longer vacancies and softer asking-rent achievability than the comps imply.
- What's the recent tenant-quality profile in this submarket — average credit score on applications, eviction rate, late-payment / NSF rate, and stable-employment percentage? A property-management company in the area should have these aggregated.
- How much new for-sale + rental construction is in the pipeline within 1–3 miles? Heavy new supply typically softens prices + rents 12–24 months out; constrained supply supports both.
Investment metrics
- 1% rule
- 0.68% ✗
- Cap rate
- 4.47%
- Cash-on-cash
- -6.50%
- DSCR
- 0.71
- GRM
- 12.3
CMA / ARV
- ARV (median comp)
- $183,734
- List price
- $142,500
- Delta
- -22.44%
- Verdict
- UNDERPRICED
- Comps
- 20 within 1.0 mi
Show comp detail 6 sales within ~0.75 mi
| Address | Dist | Beds/Ba | Sqft | Sold | Price | $/sf | Match |
|---|---|---|---|---|---|---|---|
| 1718 Oakland Rd NE | 0.42mi | 2/1.0 (+1) | 1,232 (-9%) | 18mo | $184,000 | $149 | 44 |
| 638 36th St St NE | 0.63mi | 2/2.0 (+1) | 1,468 (+8%) | 13mo | $215,000 | $146 | 38 |
| 1722 Center Point Rd NE | 0.55mi | 2/2.0 (+1) | 1,260 (-7%) | 19mo | $137,750 | $109 | 37 |
| 1124 27th St NE | 0.39mi | 2/1.0 (+1) | 1,171 (-14%) | 20mo | $135,000 | $115 | 37 |
| 1254 Elmhurst Dr Dr NE | 0.63mi | 2/1.0 (+1) | 1,463 (+8%) | 23mo | $167,000 | $114 | 33 |
| 1305 Maplewood Dr NE | 0.65mi | 2/1.0 (+1) | 1,205 (-11%) | 22mo | $181,000 | $150 | 27 |
Match score weights: distance 35% · size 25% · config 20% · recency 20%. Top-matched comps best support the ARV.
Projected returns pro-forma
-3.0% appreciation · 8.0% rent growth · sell at horizon
- IRR
- -22.2%
- Equity multiple
- 0.20×
- Total profit
- $-31,739
- Equity at exit
- $21,247
- IRR
- -7.2%
- Equity multiple
- 0.45×
- Total profit
- $-22,056
- Equity at exit
- $12,321
Cash invested: $39,900 (down + closing). Projections, not guarantees.
Landlord ↔ Tenant lean methodology
- Overall (STATE)
- 83 Strongly Landlord-Friendly
- State Iowa
- 83 Strongly Landlord-Friendly · R+6
- County
- — inherits STATE
- City
- — inherits STATE
ZIP-level market 52402
- Rents YoY
- 11.0%
- Active inventory
- 286
- Price-to-rent
- 12.3×
Monthly cashflow live
- Estimated rent
- $967 medium interval (Pro) →
- Mortgage (P&I)
- −$747
- Tax from tax record
- −$174 /mo · $2,084/yr
- Insurance
- −$59
- HOA
- −$0
- Vacancy / Maint / Mgmt
- −$203
- Net cashflow
- $-216
Break-even live
UW: 25.0% down · 7.5% · 30yr · 1.5% tax · 5.0% vac · 8.0% maint · 8.0% mgmt
Financing live
Cash to close
- Down payment
- $35,625
- Closing costs
- $4,275
- Reserves months
- —
- Total cash needed
- —
Loan-product check · same deal, 3 products live
Conventional
25% down · 7.5% · 30yr
- Down + closing
- —
- Monthly P&I
- —
- Monthly cashflow
- —
- DSCR
- —
- Eligible?
- —
Personal DTI + credit; lowest rate.
DSCR
20% down · 8.5% · 30yr
- Down + closing
- —
- Monthly P&I
- —
- Monthly cashflow
- —
- DSCR
- —
- Eligible?
- —
No personal income docs; deal must DSCR.
Hard money
10% down · 12.0% · 12mo
- Down + closing
- —
- Monthly P&I
- —
- Monthly cashflow
- —
- DSCR
- —
- Eligible?
- —
Short-term bridge; refi at stabilization.
Rent comps 4 comps
| Address | Beds | Baths | Sqft | Rent | $/sqft | DOM | Units | Dist |
|---|---|---|---|---|---|---|---|---|
| 4025 Sherman St NE Cedar Rapids, IA | 1.0–2.0 | 1.0–1.5 | 742 | $765 | $1.03 | 13d | 1 | 0.71mi |
| 511 23rd St NE Cedar Rapids, IA | 2.0 | 1.0 | 888 | $1,500 | $1.69 | 43d | 1 | 0.94mi |
| 1220 Sierra Dr NE Cedar Rapids, IA | 1.0–2.0 | 1.0–2.0 | 985 | $625 | $0.63 | 43d | 1 | 0.98mi |
| 306 29th Street Dr SE Cedar Rapids, IA | 2.0 | 1.0 | 1100 | $850 | $0.77 | 21d | 1 | 1.19mi |
Listing history 18 events
-
2026-06-03statusdays on market $142,500 Pending 43 DOM
-
2026-06-02days on market $142,500 Active 42 DOM
-
2026-06-01days on market $142,500 Active 41 DOM
-
2026-05-31days on market $142,500 Active 40 DOM
-
2026-05-30days on market $142,500 Active 39 DOM
-
2026-05-01price $142,500 634-char remark
Show marketing remark (634 chars)
Looking for a home that blends comfort, style, and convenience? This charming 2-bedroom, 1-bath home offers an open and inviting layout with thoughtful updates throughout. Enjoy a bright and spacious living area that flows seamlessly into the dining space and a trendy, functional kitchen—perfect for everyday living and entertaining. Step outside through the sliding glass doors to a fully fenced backyard—ideal for pets, relaxing evenings, or hosting friends around a fire pit. Located just minutes from bike trails, grocery stores, and quick interstate access! Property is being sold as is. Schedule your showing today!
-
2026-04-21$150,000 Active 634-char remark
Show marketing remark (634 chars)
Looking for a home that blends comfort, style, and convenience? This charming 2-bedroom, 1-bath home offers an open and inviting layout with thoughtful updates throughout. Enjoy a bright and spacious living area that flows seamlessly into the dining space and a trendy, functional kitchen—perfect for everyday living and entertaining. Step outside through the sliding glass doors to a fully fenced backyard—ideal for pets, relaxing evenings, or hosting friends around a fire pit. Located just minutes from bike trails, grocery stores, and quick interstate access! Property is being sold as is. Schedule your showing today!
-
2025-10-03price $160,000
-
2023-11-22soldstatus $148,500 Closed
-
2023-11-22soldstatus $148,500
-
2023-11-04status Pending
-
2023-10-10$150,000 Active
-
2021-03-22soldstatus $75,000
-
2021-03-22soldstatus $116,000
-
2021-03-08soldstatus $116,000
-
2021-01-26$109,500
-
2013-09-19soldstatus $75,000
-
2013-09-03soldstatus $72,000
ⓘ Source: listings_history table (triggers on properties + properties_extension) + one-shot
backfill from property_details.listing_events for pre-trigger history.
Tax reassessment forecast IA · Partial reset (capped growth)
- Current annual tax
- $2,084 · $174/mo
- Projected year-2 tax
- $2,161 · $180/mo
- Expected delta
- +$77/yr (+$6/mo · 3.7%)
ⓘ Screening estimate from a state-policy table — verify with the county assessor before closing.
Climate risk First Street
- Flood 1/10 Low FEMA zone X (unshaded) · 0% chance over 30 yrs
- Wildfire 1/10 Low
- Heat 3/10 Moderate 7 d/yr ≥104°F today · 15 d/yr by 30 yrs out
- Wind 2/10 Low
- Air quality 2/10 Low 0 unhealthy d/yr today · 1 by 30 yrs out
Nearby sold comps map
Loading sold comps map…
Walkable amenities ~0.75 mi
Loading nearby amenities…
Taxation est. · year 1
- Rental income
- $11,607
- − Mortgage interest
- −$7,982
- − Property taxes
- −$2,084
- − Insurance
- −$712
- − Repairs & maintenance
- −$929
- − Management
- −$929
- − Depreciation
- −$4,145
- Taxable loss
- −$5,174
- Est. tax savings @ 24.0%
- +$1,242
- After-tax cash flow
- $-1,353/yr
For passive investors: Depreciation is non-cash, so a rental often shows a tax loss while cash-flowing — sheltering income. Rental losses are passive: they offset passive income freely, and up to $25,000/yr can offset ordinary (W-2) income if you actively participate and your MAGI is under $100k (phasing out to $0 by $150k); unused losses carry forward. On sale, claimed depreciation is recaptured at up to 25%, and gains may owe capital-gains tax (a 1031 exchange can defer both). Figures are a year-1 estimate at your 24.0% rate — not tax advice; consult a CPA.
Schools (NCES district)
- District
- Cedar Rapids Community School District
- NCES district ID
- 1906540
- Math proficiency
- 50% ▼ -12.00%
- Reading proficiency
- 59% ▼ -6.00%
- Median HH income
- $53,568
- Composite
- 46.82/100
- National rank
- #2378
- State rank
- #265 of 289 in IA
Livability — Cedar Rapids
- Score
- 78/100
- State rank
- #134
- US rank
- #2474
Category grades
Schools grade is shown separately in the Schools card above.
Census & demographics
- Census place
- Cedar Rapids, IA
- County
- Linn County · 179,860 people
- City population
- 137,154
- Metro
- Cedar Rapids, IA
- Population (ZIP)
- 42,938
- Household income
- $73,439
- Rent vs Own
- Severe rent burden
- 971.0
Population outlook (Linn County) Hauer SSP2
- Today (2025)
- 239,589 people
- By 2030
- 248,587 · +3.8%
- By 2040
- 264,817 · +10.5%
- By 2050
- 278,685 · +16.3%
- By 2075
- 311,754 · +30.1%
- By 2100
- 336,773 · +40.6%
Race, ethnicity, and origin ACS 2023
- Neighborhood character
- Predominantly White (77%)
- Race & ethnicity
- White 77% Two or more races 7% Black 6% Asian 6% Hispanic / Latino 4%
- Common ancestry
- Portuguese 4% Lithuanian 2% Iranian 2%
- Foreign-born
- 8% · Canada, Philippines, China
- Languages at home
- 89% English-only · Spanish 3% Other Indo-European 3% Other Asian/Pacific 2%
Political lean MEDSL · Linn
- 2024 margin
- Lean D (+9.9) · D 54.2% · R 44.3% · Other 1.4%
- 2008→2024 swing
- -11.6pp toward R · 2008: 21.5pp · 2024: 9.9pp
- All cycles
- 2024: D+9.9 2020: D+13.7 2016: D+9.0 2012: D+17.6 2008: D+21.5
Not yet ingested
- Civics
- —
Market trends
- HPI YoY
- ▼ -133.31%
- Current HPI
- 201.7061
- Rent YoY
- ▲ 10.97%
- Metro
- Cedar Rapids, IA
- State GDP YoY
- ▲ 2.48%
- F500 in state
- 4
Industry mix (Fortune 500 HQ in IA)
| Industry | F500 HQs | Revenue |
|---|---|---|
| Financial Services | 1 | $16B |
|
||
| Retail / Convenience | 1 | $15B |
|
||
Price history
+97.9% since first listed13 events — show timeline
- 2026-05-01 Price Changed $142,500 CRAAR, CDRMLS
- 2026-04-21 Listed $150,000 CRAAR, CDRMLS
- 2025-10-03 Price Changed $160,000 CRAAR, CDRMLS
- 2023-11-22 Sold (Public Records) $148,500 Public Records
- 2023-11-22 Sold (MLS) $148,500 CRAAR, CDRMLS
- 2023-11-04 Pending — CRAAR, CDRMLS
- 2023-10-10 Listed $150,000 CRAAR, CDRMLS
- 2021-03-22 Sold (Public Records) $116,000 Public Records
- 2021-03-22 Sold (Public Records) $75,000 Public Records
- 2021-03-08 Sold (MLS) $116,000 CRAAR, CDRMLS
- 2021-01-26 Listed $109,500 CRAAR, CDRMLS
- 2013-09-19 Sold (Public Records) $75,000 Public Records
- 2013-09-03 Sold (Public Records) $72,000 Public Records
Property tax history
+2.0%/yrLatest (2024): $2,084 · -7.8% YoY. Source: county tax records.
Cash-flow waterfall
monthlySold comps — $/sqft
last 12 mo · ≤1 miLoading sold comps…