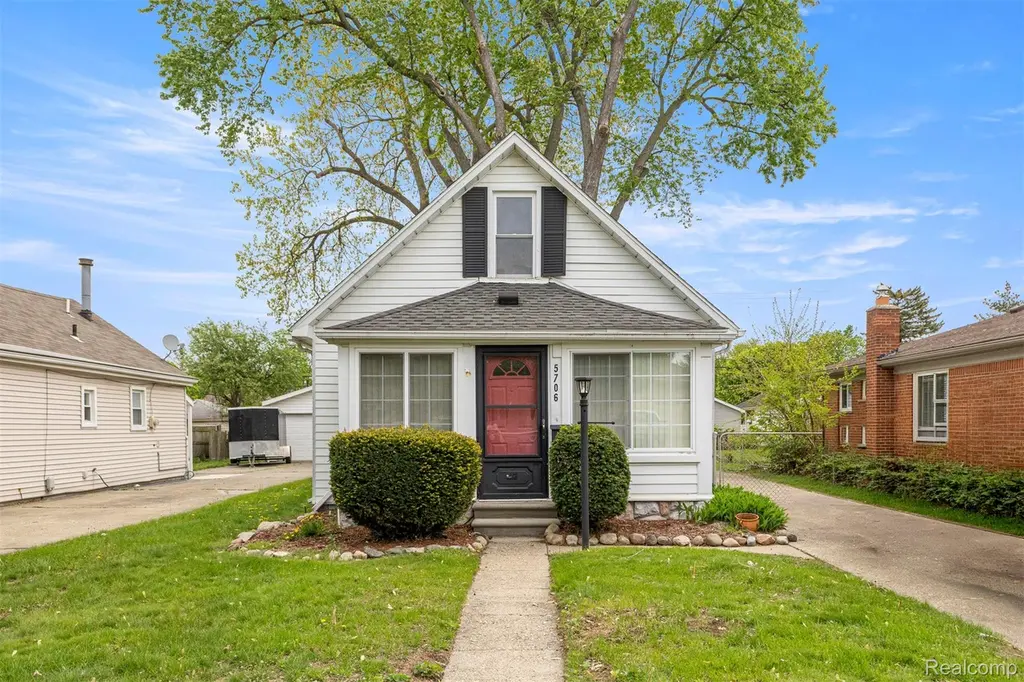
5706 Robindale Ave
Dearborn Heights, MI 48127
$169,000C
3 bd · 1.0 ba ·
976 sqft ·
Built 1936
· SingleFamily
· Active
· 28 DOM
Cashflow @ list (25.0% down · 7.5%)
Estimated rent
$1,726/mo
Mortgage (P&I)
−$886
Tax + insurance
−$272
HOA
−$0
Vac / Maint / Mgmt
−$363
Net cashflow
$206/mo
Annual
$2,473/yr
Cap rate
7.76%
Cash-on-cash
5.23%
DSCR
1.23
1% rule
1.02%
Cash to close
$47,320
Investor read
- This is a 3-bed/1.0-bath single-family listed at $169k.
- At list price, monthly cash flow is $206 ($2k/yr) — positive.
- The deal already cash-flows at list — no discount required.
- Meets the 1% rule at list price ($2k rent vs $169k).
- It's been on market 28 days — a 2% lower offer ($166k) is reasonable based on typical stale-listing flexibility.
- Recommended offer: $166k (1.5% below list) — sets the bar for market timing.
- Local home prices are declining (-3.0%/yr); year-one equity from $1k of loan paydown is wiped out by about $5k of value loss. Plan a longer hold.
- Location reads 79/100 on livability (#82 in MI, #1,885 nationally) — a middle-class / working-renter tenant base. Strengths: commute A+, cost of living A+, housing A+; Watch: schools C-, crime D+, employment D+.
- Crestwood School District (suburban): math 32% / reading 43% proficiency, ranked #242 of 540 in MI (top 45%) — families likely to look elsewhere, expect single-tenant / working-renter base with shorter leases.
- Watch-outs: built in 1936 — expect roof / HVAC / electrical / plumbing capex.
- Market conditions: Rents flat; 143 active listings in the ZIP; 11 comparable units currently listed for rent nearby; rentals at typical pace (median 15d on market — plan ~3-4 weeks tenant-placement turnaround); 2,639 units permitted in Wayne County in 2024 (1,216 in 5+ unit buildings).
- Wayne County population projected at -17% by 2050 — secular population decline; favor cash flow + early exit over multi-decade hold.
- 2 sale attempts with the ask held roughly flat each time — persistent listings suggest the price (not the market) is what's stuck; bring a comps-based counter.
- Current owner paid $83k; list at $169k implies a 104% gain — meaningful room to come down on a strong offer.
- Cap rate 7.8% vs local median 5.5% in Dearborn Heights — top-decile yield for the area; either an underpriced asset or a hidden risk that comps aren't pricing in. Stress-test before assuming the spread holds.
- This rent runs 34% of the median local income ($61k/yr) — at the standard rent-burdened threshold; future hikes will face affordability resistance.
Questions for listing agent
- Built in 1936 — when were the roof, HVAC, electrical panel, plumbing, and water heater last replaced?
- Is there a deadline driving the sale (1031 exchange, divorce, estate, relocation)? That informs how much negotiation room exists.
- Crime grade is D in this area — have there been break-ins, vandalism, or insurance claims at this property in the last 3 years? What carrier currently insures it and at what premium?
- What's the average days-on-market for RENTAL listings here right now (not sales)? A rising rental-DOM trend means longer vacancies and softer asking-rent achievability than the comps imply.
- What's the recent tenant-quality profile in this submarket — average credit score on applications, eviction rate, late-payment / NSF rate, and stable-employment percentage? A property-management company in the area should have these aggregated.
- How much new for-sale + rental construction is in the pipeline within 1–3 miles? Heavy new supply typically softens prices + rents 12–24 months out; constrained supply supports both.
CashFlowRE · CFR-QM3WDXBC0SX4PN
· Data 2 days ago
cashflowre.app · 2026-05-29