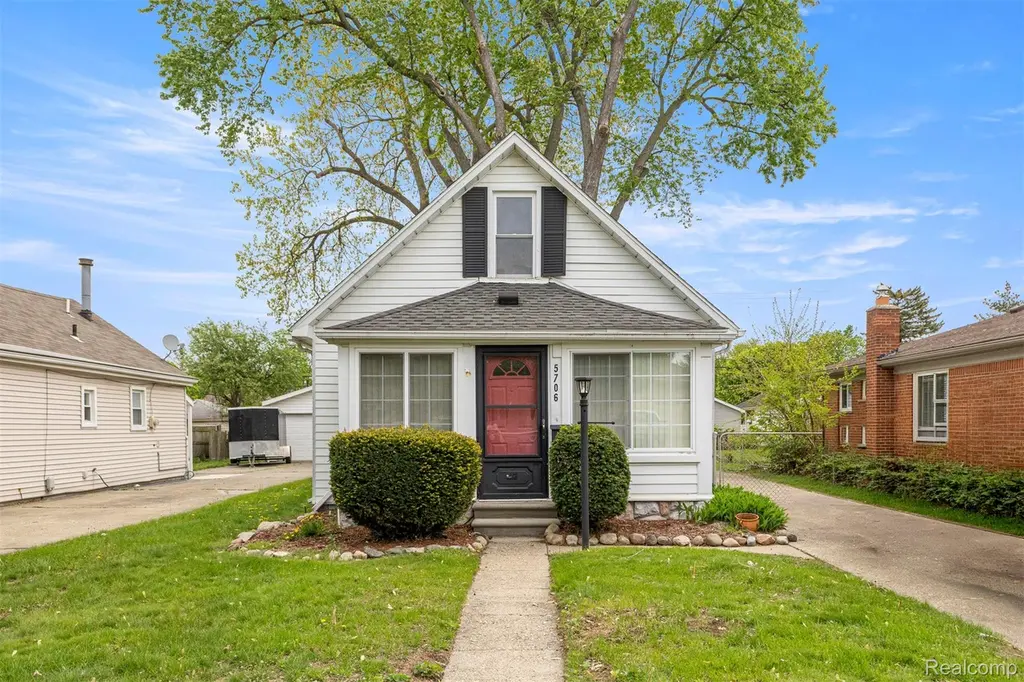
5706 Robindale Ave · Dearborn Heights, MI
Flood risk 1/10 · Minimal
- FEMA flood zone
- X (unshaded)
- Chance of flooding over 30 yrs
- 0.0%
- Est. flood insurance / yr
- $507 – $1,088
Fire risk 1/10 · Minimal
- Est. fire insurance / yr
- $784 – $1,456
Heat risk 3/10 · Minor
- Hot days now (above 98°F)
- 7 days/yr
- Hot days in 30 yrs
- 15 days/yr
Wind risk 2/10 · Minimal
- Chance of severe wind over 30 yrs
- —
Air-quality risk 2/10 · Minimal
- Unhealthy air days now
- 1 days/yr
- Unhealthy air days in 30 yrs
- 2 days/yr
Risk factors via First Street. Map © Google.
Why this score? — see what drove the C grade
The composite is a weighted blend of 9 inputs, each scored 0–100. Each bar is that input's sub-score; the figure is the points it added to the 100-point composite (weight × sub-score).
- Cash flow +20.0/30.0
- ARV discount +15.0/15.0
- DSCR +6.3/10.0
- 1% rule +5.2/10.0
- Livability +4.0/5.0
- Schools +3.2/10.0
- Rent growth +2.6/5.0
- Condition / age +2.5/5.0
- Appreciation +0.0/10.0
$169,000
🖨 Deal sheet 📄 Offer letter ✓ Due diligence
Listing remarks MLS
Charming and full of potential, this Dearborn Heights bungalow offers a warm and inviting layout with plenty of space to make your own! Featuring a spacious living room, cozy dining area, and generously sized kitchen with ample cabinet space, this home is perfect for everyday living and entertaining alike. The large upper-level space provides endless possibilities for an additional bedroom, office, or flex area. Enjoy the convenience of a long driveway, detached garage, and a nicely sized yard ideal for outdoor gatherings or relaxing evenings. Character throughout the home adds a cozy feel, while the functional layout offers great opportunity for personalization and updates over time. Located in a desirable Dearborn Heights neighborhood close to parks, schools, shopping, and dining, this home is a great opportunity for homeowners or investors alike!
Key facts
- Nicely sized yard
- Ample cabinet space
- Long driveway
Tags
Property features AI
Exterior
- Parking: Detached 1-car garage
- Utilities: Public water; Public sewer; Sewer and water available
- Home design: Single-family residence; One and one-half stories; Ground-level entry with steps
- Construction: Aluminum siding; Block foundation
- Exterior features: Paved road access; Lot approximately 40 x 135 (0.12 acres)
Interior
- Bathrooms: 1 full bathroom
- Heating & cooling: Forced air heating (natural gas); No central cooling
- Interior features: Finished basement; Total of 4 rooms
Neighborhood map
What this means for you Summary
Snapshot
- This is a 3-bed/1.0-bath single-family listed at $169k.
Deal economics
- At list price, monthly cash flow is $206 ($2k/yr) — positive.
- The deal already cash-flows at list — no discount required.
- Meets the 1% rule at list price ($2k rent vs $169k).
- Recommended offer: $166k (1.5% below list) — sets the bar for market timing.
- Cap rate 7.8% vs local median 5.5% in Dearborn Heights — top-decile yield for the area; either an underpriced asset or a hidden risk that comps aren't pricing in. Stress-test before assuming the spread holds.
Location & tenants
- Location reads 79/100 on livability (#82 in MI, #1,885 nationally) — a middle-class / working-renter tenant base. Strengths: commute A+, cost of living A+, housing A+; Watch: schools C-, crime D+, employment D+.
- Crestwood School District (suburban): math 32% / reading 43% proficiency, ranked #242 of 540 in MI (top 45%) — families likely to look elsewhere, expect single-tenant / working-renter base with shorter leases.
- Market conditions: Rents flat; 143 active listings in the ZIP; 11 comparable units currently listed for rent nearby; rentals at typical pace (median 15d on market — plan ~3-4 weeks tenant-placement turnaround); 2,639 units permitted in Wayne County in 2024 (1,216 in 5+ unit buildings).
- This rent runs 34% of the median local income ($61k/yr) — at the standard rent-burdened threshold; future hikes will face affordability resistance.
Forward outlook
- Local home prices are declining (-3.0%/yr); year-one equity from $1k of loan paydown is wiped out by about $5k of value loss. Plan a longer hold.
- Wayne County population projected at -17% by 2050 — secular population decline; favor cash flow + early exit over multi-decade hold.
Negotiation context
- It's been on market 28 days — a 2% lower offer ($166k) is reasonable based on typical stale-listing flexibility.
- 2 sale attempts with the ask held roughly flat each time — persistent listings suggest the price (not the market) is what's stuck; bring a comps-based counter.
- Current owner paid $83k; list at $169k implies a 104% gain — meaningful room to come down on a strong offer.
Risks & watch-outs
- Watch-outs: built in 1936 — expect roof / HVAC / electrical / plumbing capex.
Questions for the listing agent
- Built in 1936 — when were the roof, HVAC, electrical panel, plumbing, and water heater last replaced?
- Is there a deadline driving the sale (1031 exchange, divorce, estate, relocation)? That informs how much negotiation room exists.
- Crime grade is D in this area — have there been break-ins, vandalism, or insurance claims at this property in the last 3 years? What carrier currently insures it and at what premium?
- What's the average days-on-market for RENTAL listings here right now (not sales)? A rising rental-DOM trend means longer vacancies and softer asking-rent achievability than the comps imply.
- What's the recent tenant-quality profile in this submarket — average credit score on applications, eviction rate, late-payment / NSF rate, and stable-employment percentage? A property-management company in the area should have these aggregated.
- How much new for-sale + rental construction is in the pipeline within 1–3 miles? Heavy new supply typically softens prices + rents 12–24 months out; constrained supply supports both.
Investment metrics
- 1% rule
- 1.02% ✓
- Cap rate
- 7.76%
- Cash-on-cash
- 5.23%
- DSCR
- 1.23
- GRM
- 8.2
CMA / ARV
- ARV (on-the-fly)
- $225,456
- Comps found
- 12
Show comp detail 12 sales within ~0.75 mi
| Address | Dist | Beds/Ba | Sqft | Sold | Price | $/sf | Match |
|---|---|---|---|---|---|---|---|
| 5955 N Silvery Ln | 0.12mi | 2/1.0 (-1) | 975 (-0%) | 4mo | $224,900 | $231 | 86 |
| 5939 Robindale Ave | 0.11mi | 3/1.0 | 900 (-8%) | 4mo | $190,000 | $211 | 78 |
| 5763 N Silvery Ln | 0.06mi | 3/1.0 | 1,110 (+14%) | 2mo | $153,000 | $138 | 73 |
| 24903 Hass St | 0.38mi | 3/1.5 | 999 (+2%) | 5mo | $255,000 | $255 | 72 |
| 6556 Drexel St | 0.69mi | 3/1.0 | 988 (+1%) | 1mo | $230,000 | $233 | 64 |
| 6165 Nightingale St | 0.30mi | 2/1.0 (-1) | 864 (-12%) | 1mo | $150,000 | $174 | 61 |
| 5651 Fenton St | 0.29mi | 2/1.0 (-1) | 848 (-13%) | 2mo | $145,000 | $171 | 58 |
| 6523 N Vernon St | 0.61mi | 3/1.5 | 1,007 (+3%) | 7mo | $247,000 | $245 | 58 |
| 2045 N Vernon St | 0.40mi | 3/1.0 | 1,092 (+12%) | 8mo | $245,000 | $224 | 55 |
| 6894 N Gulley Rd | 0.73mi | 3/1.5 | 999 (+2%) | 6mo | $235,000 | $235 | 55 |
| 25659 Baldwin St | 0.58mi | 3/1.5 | 1,080 (+11%) | 1mo | $281,000 | $260 | 53 |
| 6822 N Lafayette St | 0.70mi | 3/1.0 | 1,080 (+11%) | 0mo | $150,000 | $139 | 49 |
Match score weights: distance 35% · size 25% · config 20% · recency 20%. Top-matched comps best support the ARV.
Projected returns pro-forma
-3.0% appreciation · 0.41% rent growth · sell at horizon
- IRR
- -11.1%
- Equity multiple
- 0.61×
- Total profit
- $-18,623
- Equity at exit
- $25,198
- IRR
- -6.0%
- Equity multiple
- 0.66×
- Total profit
- $-16,319
- Equity at exit
- $14,612
Cash invested: $47,320 (down + closing). Projections, not guarantees.
Landlord ↔ Tenant lean methodology
- Overall (STATE)
- 62 Landlord-Friendly
- State Michigan
- 62 Landlord-Friendly · EVEN
- County
- — inherits STATE
- City
- — inherits STATE
ZIP-level market 48127
- Rents YoY
- 0.4%
- Active inventory
- 143
- Price-to-rent
- 8.2×
Monthly cashflow live
- Estimated rent
- $1,726 high interval (Pro) →
- Mortgage (P&I)
- −$886
- Tax from tax record
- −$201 /mo · $2,414/yr
- Insurance
- −$70
- HOA
- −$0
- Vacancy / Maint / Mgmt
- −$363
- Net cashflow
- $206
Break-even live
UW: 25.0% down · 7.5% · 30yr · 1.5% tax · 5.0% vac · 8.0% maint · 8.0% mgmt
Financing live
Cash to close
- Down payment
- $42,250
- Closing costs
- $5,070
- Reserves months
- —
- Total cash needed
- —
Loan-product check · same deal, 3 products live
Conventional
25% down · 7.5% · 30yr
- Down + closing
- —
- Monthly P&I
- —
- Monthly cashflow
- —
- DSCR
- —
- Eligible?
- —
Personal DTI + credit; lowest rate.
DSCR
20% down · 8.5% · 30yr
- Down + closing
- —
- Monthly P&I
- —
- Monthly cashflow
- —
- DSCR
- —
- Eligible?
- —
No personal income docs; deal must DSCR.
Hard money
10% down · 12.0% · 12mo
- Down + closing
- —
- Monthly P&I
- —
- Monthly cashflow
- —
- DSCR
- —
- Eligible?
- —
Short-term bridge; refi at stabilization.
Rent comps 11 comps
| Address | Beds | Baths | Sqft | Rent | $/sqft | DOM | Units | Dist |
|---|---|---|---|---|---|---|---|---|
| 5722 Centralia St Dearborn Heights, MI | 3.0 | 1.0 | 999 | $1,750 | $1.75 | 1d | 1 | 0.51mi |
| 7080 Highview St Dearborn Heights, MI | 3.0 | 2.5 | 1105 | $2,000 | $1.81 | 18d | 1 | 0.84mi |
| 7014 Kinmore St Dearborn Heights, MI | 3.0 | 1.0 | 960 | $1,900 | $1.98 | 21d | 1 | 0.84mi |
| 181 Terri Dr Unit 181 Dearborn Heights, MI | 2.0 | 2.0 | 840 | $1,119 | $1.33 | 5d | 1 | 1.03mi |
| 79 3rd St Unit 79 Dearborn Heights, MI | 2.0 | 1.0 | 840 | $1,339 | $1.59 | 24d | 1 | 1.16mi |
| 7420 Drexel St Dearborn Heights, MI | 2.0 | 1.0 | 1080 | $1,700 | $1.57 | 43d | 1 | 1.16mi |
| 7420 Drexel St Dearborn Heights, MI | 2.0 | 1.0 | 1080 | $1,600 | $1.48 | 4d | 1 | 1.16mi |
| 7420 Drexel St Dearborn Heights, MI | 2.0 | 1.0 | 1080 | $1,700 | $1.57 | 17d | 1 | 1.16mi |
| 7462 N Vernon St Dearborn Heights, MI | 4.0 | 1.0 | 1113 | $1,900 | $1.71 | 1d | 1 | 1.18mi |
| 167 Cherry Valley Dr Inkster, MI | 1.0–2.0 | 1.0 | 784 | $1,395 | $1.78 | 14d | 12 | 1.32mi |
| 26322 Westphal St Dearborn Heights, MI | 1.0–2.0 | 1.0 | 762 | $1,455 | $1.91 | 1d | 24 | 1.33mi |
Listing history 17 events
-
2026-06-18days on market $169,000 Active 28 DOM
-
2026-06-17days on market $169,000 Active 27 DOM
-
2026-06-16days on market $169,000 Active 26 DOM
-
2026-06-15days on market $169,000 Active 25 DOM
-
2026-06-13days on market $169,000 Active 23 DOM
-
2026-06-13days on market $169,000 Active 22 DOM
-
2026-06-09days on market $169,000 Active 19 DOM
-
2026-06-08days on market $169,000 Active 18 DOM
-
2026-06-07days on market $169,000 Active 17 DOM
-
2026-06-04days on market $169,000 Active 14 DOM
-
2026-06-03days on market $169,000 Active 13 DOM
-
2026-06-02days on market $169,000 Active 12 DOM
-
2026-06-01days on market $169,000 Active 11 DOM
-
2026-05-31days on market $169,000 Active 10 DOM
-
2026-05-21$169,000 Active
Show marketing remark (861 chars)
Charming and full of potential, this Dearborn Heights bungalow offers a warm and inviting layout with plenty of space to make your own! Featuring a spacious living room, cozy dining area, and generously sized kitchen with ample cabinet space, this home is perfect for everyday living and entertaining alike. The large upper-level space provides endless possibilities for an additional bedroom, office, or flex area. Enjoy the convenience of a long driveway, detached garage, and a nicely sized yard ideal for outdoor gatherings or relaxing evenings. Character throughout the home adds a cozy feel, while the functional layout offers great opportunity for personalization and updates over time. Located in a desirable Dearborn Heights neighborhood close to parks, schools, shopping, and dining, this home is a great opportunity for homeowners or investors alike!
-
2026-05-21$169,000 Active 861-char remark
Show marketing remark (861 chars)
Charming and full of potential, this Dearborn Heights bungalow offers a warm and inviting layout with plenty of space to make your own! Featuring a spacious living room, cozy dining area, and generously sized kitchen with ample cabinet space, this home is perfect for everyday living and entertaining alike. The large upper-level space provides endless possibilities for an additional bedroom, office, or flex area. Enjoy the convenience of a long driveway, detached garage, and a nicely sized yard ideal for outdoor gatherings or relaxing evenings. Character throughout the home adds a cozy feel, while the functional layout offers great opportunity for personalization and updates over time. Located in a desirable Dearborn Heights neighborhood close to parks, schools, shopping, and dining, this home is a great opportunity for homeowners or investors alike!
-
2020-08-17soldstatus $83,000
ⓘ Source: listings_history table (triggers on properties + properties_extension) + one-shot
backfill from property_details.listing_events for pre-trigger history.
Tax reassessment forecast MI · Partial reset (capped growth)
- Current annual tax
- $2,414 · $201/mo
- Projected year-2 tax
- $2,508 · $209/mo
- Expected delta
- +$94/yr (+$8/mo · 3.9%)
ⓘ Screening estimate from a state-policy table — verify with the county assessor before closing.
Climate risk First Street
- Flood 1/10 Low FEMA zone X (unshaded) · 0% chance over 30 yrs
- Wildfire 1/10 Low
- Heat 3/10 Moderate 7 d/yr ≥98°F today · 15 d/yr by 30 yrs out
- Wind 2/10 Low
- Air quality 2/10 Low 1 unhealthy d/yr today · 2 by 30 yrs out
Nearby sold comps map
Loading sold comps map…
Walkable amenities ~0.75 mi
Loading nearby amenities…
Taxation est. · year 1
- Rental income
- $20,718
- − Mortgage interest
- −$9,467
- − Property taxes
- −$2,414
- − Insurance
- −$845
- − Repairs & maintenance
- −$1,657
- − Management
- −$1,657
- − Depreciation
- −$4,916
- Taxable loss
- −$239
- Est. tax savings @ 24.0%
- +$57
- After-tax cash flow
- $2,531/yr
For passive investors: Depreciation is non-cash, so a rental often shows a tax loss while cash-flowing — sheltering income. Rental losses are passive: they offset passive income freely, and up to $25,000/yr can offset ordinary (W-2) income if you actively participate and your MAGI is under $100k (phasing out to $0 by $150k); unused losses carry forward. On sale, claimed depreciation is recaptured at up to 25%, and gains may owe capital-gains tax (a 1031 exchange can defer both). Figures are a year-1 estimate at your 24.0% rate — not tax advice; consult a CPA.
Schools (NCES district)
- District
- Crestwood School District
- NCES district ID
- 2600016
- Math proficiency
- 32% ▼ -6.00%
- Reading proficiency
- 43% ▼ -4.00%
- Median HH income
- $47,101
- Composite
- 32.1/100
- National rank
- #5806
- State rank
- #242 of 540 in MI
Livability — Dearborn Heights
- Score
- 79/100
- State rank
- #82
- US rank
- #1885
Category grades
Schools grade is shown separately in the Schools card above.
Census & demographics
- Census place
- Dearborn Heights, MI
- County
- Wayne County · 1,562,939 people
- City population
- 61,771
- Metro
- Detroit-Warren-Dearborn, MI
- Population (ZIP)
- 39,646
- Household income
- $60,742
- Rent vs Own
- Severe rent burden
- 1196.0
Population outlook (Wayne County) Hauer SSP2
- Today (2025)
- 1,675,273 people
- By 2030
- 1,620,300 · -3.3%
- By 2040
- 1,502,341 · -10.3%
- By 2050
- 1,384,039 · -17.4%
- By 2075
- 1,124,592 · -32.9%
- By 2100
- 881,193 · -47.4%
Race, ethnicity, and origin ACS 2023
- Neighborhood character
- Predominantly White (85%)
- Race & ethnicity
- White 85% Black 8% Two or more races 3% Hispanic / Latino 3% Asian 2%
- Common ancestry
- Arab 8% Romanian 7% Lithuanian 2%
- Foreign-born
- 31% · Canada
- Languages at home
- 46% English-only · Arabic 45% Russian/Polish/Slavic 2% Other Indo-European 2%
Political lean MEDSL · Wayne
- 2024 margin
- Strong D (+29.0) · D 62.7% · R 33.7% · Other 3.6%
- 2008→2024 swing
- -20.5pp toward R · 2008: 49.5pp · 2024: 29.0pp
- All cycles
- 2024: D+29.0 2020: D+38.1 2016: D+37.3 2012: D+46.9 2008: D+49.5
Not yet ingested
- Civics
- —
Market trends
- HPI YoY
- ▼ -319.04%
- Current HPI
- 225.9407
- Rent YoY
- ▲ 0.41%
- Metro
- Detroit-Warren-Dearborn, MI
- State GDP YoY
- ▲ 1.37%
- F500 in state
- 28
Industry mix (Fortune 500 HQ in MI)
| Industry | F500 HQs | Revenue |
|---|---|---|
| Automotive Parts | 3 | $48B |
|
||
| Automotive | 2 | $372B |
|
||
| Chemicals | 1 | $45B |
|
||
| Automotive Retail | 1 | $29B |
|
||
| Healthcare / Medical Devices | 1 | $23B |
|
||
| Automotive Technology | 1 | $20B |
|
||
Price history
+103.6% since first listed3 events — show timeline
- 2026-05-21 Listed $169,000 MiRealSource-MiMLS
- 2026-05-21 Listed $169,000 REALCOMP
- 2020-08-17 Sold (Public Records) $83,000 Public Records
Property tax history
+5.1%/yrLatest (2025): $2,414 · -19.7% YoY. Source: county tax records.
Cash-flow waterfall
monthlySold comps — $/sqft
last 12 mo · ≤1 miLoading sold comps…