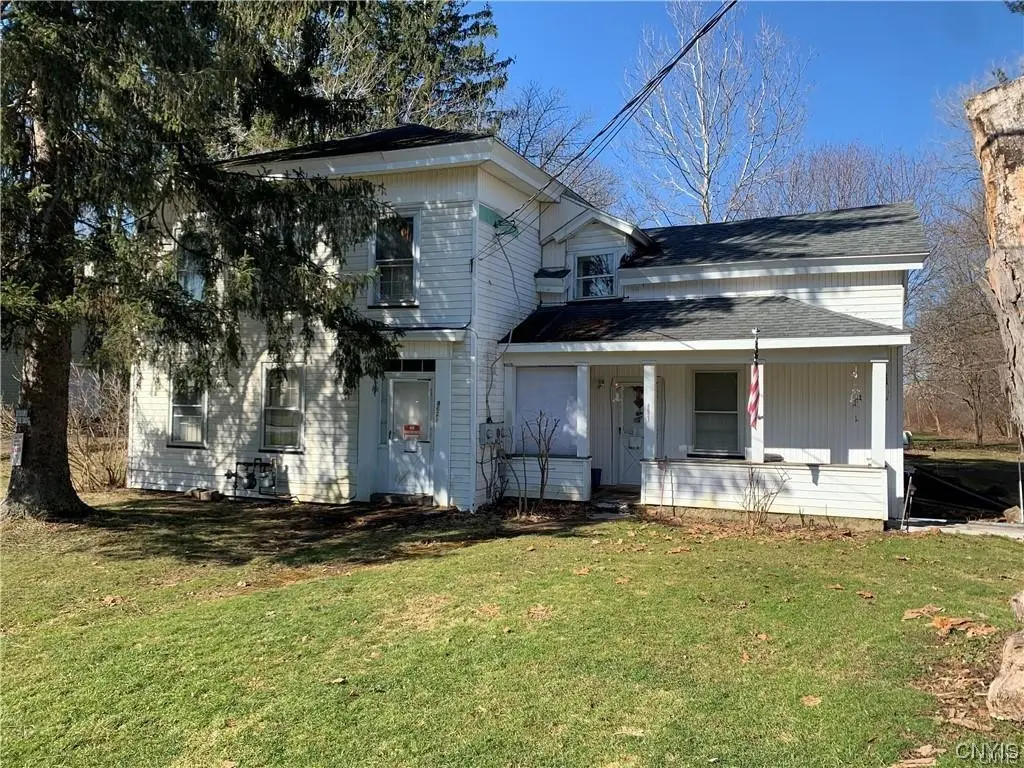
8621 Morgan Rd
Sand Ridge, NY 13041
$399,000B-
5 bd · 3.0 ba ·
2,149 sqft ·
Built 1900
· MultiFamily
· Active
· 313 DOM
Cashflow @ list (25.0% down · 7.5%)
Estimated rent
$6,525/mo
Mortgage (P&I)
−$2,092
Tax + insurance
−$844
HOA
−$0
Vac / Maint / Mgmt
−$1,370
Net cashflow
$2,218/mo
Annual
$26,622/yr
Cap rate
12.97%
Cash-on-cash
23.83%
DSCR
2.06
1% rule
1.64%
Cash to close
$111,720
Investor read
- This is a 5-bed/3.0-bath multifamily listed at $399k.
- At list price, monthly cash flow is $2k ($27k/yr) — positive.
- The deal already cash-flows at list — no discount required.
- Meets the 1% rule at list price ($7k rent vs $399k).
- It's been on market 313 days — a 12% lower offer ($351k) is reasonable based on typical stale-listing flexibility.
- Recommended offer: $351k (12.0% below list) — sets the bar for market timing.
- Local home prices are declining (-3.0%/yr); year-one equity from $3k of loan paydown is wiped out by about $12k of value loss. Plan a longer hold.
- Location reads 61/100 on livability (#926 in NY) — a middle-class / working-renter tenant base. Strengths: housing A+, cost of living A, crime A-; Watch: employment D+, schools F, amenities F.
- Liverpool Central School District (suburban): math 49% / reading 49% proficiency, ranked #381 of 590 in NY (top 65%) — families likely to look elsewhere, expect single-tenant / working-renter base with shorter leases.
- Watch-outs: built in 1900 — expect roof / HVAC / electrical / plumbing capex.
- Market conditions: 63 active listings in the ZIP; 1 comparable units currently listed for rent nearby; 616 units permitted in Onondaga County in 2024 (256 in 5+ unit buildings).
- Onondaga County population projected to shrink 9% by 2050 — rents likely to lag national; underwrite the cash flow, not the appreciation.
- 5 sale attempts since 4y ago; this cycle's ask is 33% above the opening price — seller raised mid-cycle; expect resistance to lowballs.
- Current owner paid $60k; list at $399k implies a 565% gain — meaningful room to come down on a strong offer.
- At projected returns (-3.0% appreciation + 3.0% rent growth), your $112k cash investment doubles in ~6 years — after that, you're playing with house money.
- Cap rate 13.0% vs local median 3.4% in Sand Ridge — top-decile yield for the area; either an underpriced asset or a hidden risk that comps aren't pricing in. Stress-test before assuming the spread holds.
Questions for listing agent
- It's been on market 313 days. Have you received any prior offers? Is the seller open to a 12% concession, seller financing, or rate buy-down credit?
- Built in 1900 — when were the roof, HVAC, electrical panel, plumbing, and water heater last replaced?
- Why hasn't it sold? Are there any deal-killer items the seller is aware of (foundation, flood, title, zoning, code violations)?
- Is there a deadline driving the sale (1031 exchange, divorce, estate, relocation)? That informs how much negotiation room exists.
- Schools are F-rated, which usually means shorter tenancies and higher turnover. Who's the typical renter profile here, and what's been the actual vacancy rate?
- What's the average days-on-market for RENTAL listings here right now (not sales)? A rising rental-DOM trend means longer vacancies and softer asking-rent achievability than the comps imply.
- What's the recent tenant-quality profile in this submarket — average credit score on applications, eviction rate, late-payment / NSF rate, and stable-employment percentage? A property-management company in the area should have these aggregated.
- How much new apartment / multifamily construction is in the pipeline within 1–3 miles? Heavy new supply (>2% of stock underway) typically softens rents 12–24 months out; light construction supports rent growth.
CashFlowRE · CFR-QMAFWZDF33PSBM
· Data 2 days ago
cashflowre.app · 2026-05-29