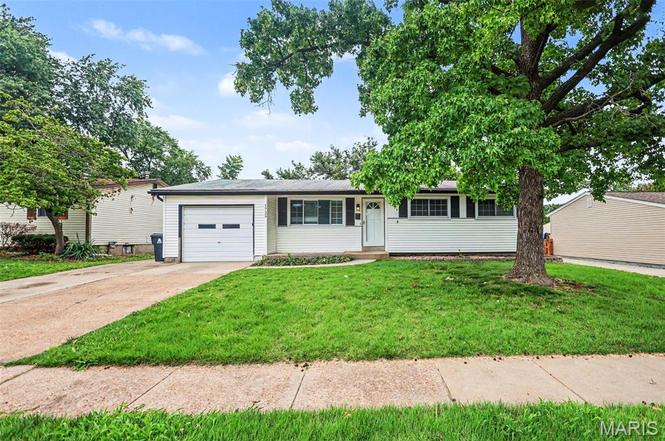
1725 Yaqui Dr
Florissant, MO 63031
$204,900F
3 bd · 2.0 ba ·
956 sqft ·
Built 1962
· SingleFamily
· Active
· 6 DOM
Cashflow @ list (25.0% down · 7.5%)
Estimated rent
$1,390/mo
Mortgage (P&I)
−$1,075
Tax + insurance
−$280
HOA
−$0
Vac / Maint / Mgmt
−$292
Net cashflow
$-257/mo
Annual
$-3,081/yr
Cap rate
4.79%
Cash-on-cash
-5.37%
DSCR
0.76
1% rule
0.68%
Cash to close
$57,372
Investor read
- This is a 3-bed/2.0-bath single-family listed at $205k.
- At list price, monthly cash flow is $-257 ($-3k/yr) — negative.
- To cash-flow at today's rent, offer at most $160k (22.1% below list).
- To meet the 1% rule (rent ≥ 1% of price), the offer needs to be $139k (32.2% below list).
- Only 6 days on market — expect competitive offers; lowballing is unlikely to land.
- Recommended offer: $139k (32.2% below list) — sets the bar for 1% rule.
- Local home prices are declining (-3.0%/yr); year-one equity from $1k of loan paydown is wiped out by about $6k of value loss. Plan a longer hold.
- Location reads 73/100 on livability (#82 in MO) — a middle-class / working-renter tenant base. Strengths: cost of living A+, housing A+, health & safety B+; Watch: crime C-, amenities D+, commute F.
- Hazelwood (suburban): math 11% / reading 26% proficiency, ranked #306 of 324 in MO (top 94%) — low school quality limits family demand, transient renter base, plan for 1-2y turnover.
- Zoned schools: Russell Elem. (math 12% / reading 37%, grade F, #879 of 1,115 statewide, top 81%, 409 students, 49% FRL); West Middle (math 17% / reading 33%, grade F, #321 of 391 statewide, top 82%, 730 students, 56% FRL); Hazelwood West High (math 16% / reading 42%, grade F, #407 of 521 statewide, top 78%, 2,042 students, 54% FRL) — zoned schools at 53% FRL track the district average.
- Market conditions: Rents rising fast (+4.3%/yr); 273 active listings in the ZIP; 19 comparable units currently listed for rent nearby; rentals at typical pace (median 26d on market — plan ~3-4 weeks tenant-placement turnaround); 920 units permitted in St. Louis County in 2024 (250 in 5+ unit buildings).
- 3 sale attempts since 15y ago with the ask held roughly flat each time — persistent listings suggest the price (not the market) is what's stuck; bring a comps-based counter.
- Current owner paid $167k; 23% above their basis — modest negotiation headroom, anchor on the comps not their cost.
- Cap rate 4.8% vs local median 6.2% in Florissant — below-typical yield; the buyer is paying a premium for something (appreciation thesis, condition, location) that the cap rate doesn't capture.
Questions for listing agent
- What do current leases actually rent for vs. the listed asking? Can we see a recent rent roll and the last 12 months of T-12 income?
- Built in 1962 — when were the roof, HVAC, electrical panel, plumbing, and water heater last replaced?
- Is there a deadline driving the sale (1031 exchange, divorce, estate, relocation)? That informs how much negotiation room exists.
- Schools are D-rated, which usually means shorter tenancies and higher turnover. Who's the typical renter profile here, and what's been the actual vacancy rate?
- The area grade is low — what's the realistic commute time and amenity access for the typical tenant pool here? Any planned neighborhood developments (good or bad) we should know about?
- What's the average days-on-market for RENTAL listings here right now (not sales)? A rising rental-DOM trend means longer vacancies and softer asking-rent achievability than the comps imply.
- What's the recent tenant-quality profile in this submarket — average credit score on applications, eviction rate, late-payment / NSF rate, and stable-employment percentage? A property-management company in the area should have these aggregated.
- How much new for-sale + rental construction is in the pipeline within 1–3 miles? Heavy new supply typically softens prices + rents 12–24 months out; constrained supply supports both.
CashFlowRE · CFR-QMJZQT7VW9BGGQ
· Data 1 h ago
cashflowre.app · 2026-05-29