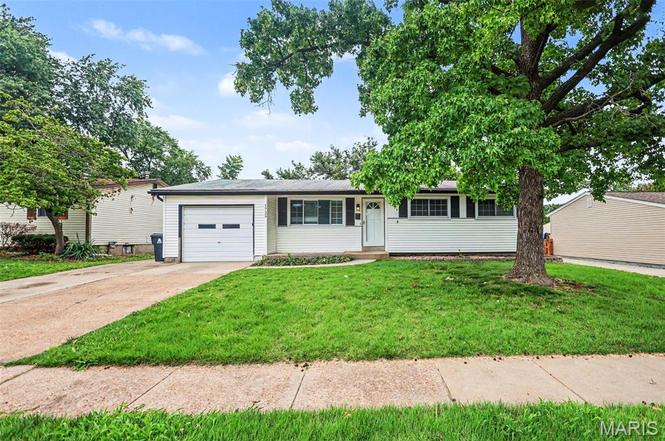
1725 Yaqui Dr · Florissant, MO
Flood risk 1/10 · Minimal
- FEMA flood zone
- X (unshaded)
- Chance of flooding over 30 yrs
- 0.0%
- Est. flood insurance / yr
- $473 – $860
Fire risk 1/10 · Minimal
- Est. fire insurance / yr
- $1,054 – $1,958
Heat risk 4/10 · Minor
- Hot days now (above 106°F)
- 7 days/yr
- Hot days in 30 yrs
- 21 days/yr
Wind risk 2/10 · Minimal
- Chance of severe wind over 30 yrs
- 1.0%
Air-quality risk 2/10 · Minimal
- Unhealthy air days now
- 2 days/yr
- Unhealthy air days in 30 yrs
- 2 days/yr
Risk factors via First Street. Map © Google.
Why this score? — see what drove the F grade
The composite is a weighted blend of 9 inputs, each scored 0–100. Each bar is that input's sub-score; the figure is the points it added to the 100-point composite (weight × sub-score).
- Cash flow +7.5/30.0
- Livability +3.7/5.0
- Rent growth +3.6/5.0
- Condition / age +2.5/5.0
- 1% rule +1.8/10.0
- Schools +1.7/10.0
- DSCR +1.6/10.0
- ARV discount +0.0/15.0
- Appreciation +0.0/10.0
$204,900
🖨 Deal sheet (PDF) 📄 Offer letter ✓ Due diligence
Listing remarks MLS
Beautiful, level yard with mature trees give this ranch home excellent curb appeal. Step inside and you are greeted with hardwood flooring and a bright family room with neutral décor. The kitchen has been beautifully updated to feature 42" custom cabinetry, glass/ceramic tile backsplash, complimenting neutral counter top, stainless steel appliances & tile flooring. The adjoining dining area offers convenient access to the brand new large composite deck with built in lighting, patio & fenced in backyard! This home boasts 3 spacious bedrooms on the main floor as well as an updated full bath. Additional living space can be found in the finished lower level complete with family/rec room, bar area, sleeping area that has been used as a 4th bedroom suite with adjoining full bathroom! Additional amenities include an oversize garage that can fit 2 cars tandem & newer HVAC! This home is move in ready and sure to please!
Key facts
- Recreation room
- Attached garage
- Finished basement
Tags
Property features AI
Finance
- Other: Living area reported as 1,756 total (approximately 956 above grade, 800 below grade)
Exterior
- Parking: Attached garage (1 car)
- Utilities: Public water; Public sewer; Electricity connected; Cable connected; Electric service (other)
- Home design: Single-family residence; One level
- Construction: Vinyl siding; Composition roof
- Exterior features: Back yard fencing; Level lot; Lot dimensions approximately 111 x 67 x 112 x 66
Interior
- Kitchen: Dishwasher; Microwave; Range; Refrigerator
- Bedrooms: 3 bedrooms (all on the main level); Bedroom sizes: ~13 x 14, 11 x 10, 11 x 11
- Flooring: Hardwood flooring
- Bathrooms: 2 full bathrooms (both on the main level)
- Heating & cooling: Forced air heating (natural gas); Central air conditioning
- Interior features: Smart thermostat; Finished basement
Neighborhood map
What this means for you Summary
Snapshot
- This is a 3-bed/2.0-bath single-family listed at $205k.
Deal economics
- At list price, monthly cash flow is $-257 ($-3k/yr) — negative.
- To cash-flow at today's rent, offer at most $160k (22.1% below list).
- To meet the 1% rule (rent ≥ 1% of price), the offer needs to be $139k (32.2% below list).
- Recommended offer: $139k (32.2% below list) — sets the bar for 1% rule.
- Cap rate 4.8% vs local median 6.3% in Florissant — below-typical yield; the buyer is paying a premium for something (appreciation thesis, condition, location) that the cap rate doesn't capture.
Location & tenants
- Location reads 73/100 on livability (#82 in MO) — a middle-class / working-renter tenant base. Strengths: cost of living A+, housing A+, health & safety B+; Watch: crime C-, amenities D+, commute F.
- Hazelwood (suburban): math 11% / reading 26% proficiency, ranked #306 of 324 in MO (top 94%) — low school quality limits family demand, transient renter base, plan for 1-2y turnover.
- Zoned schools: Russell Elem. (math 12% / reading 37%, grade F, #879 of 1,115 statewide, top 81%, 409 students, 49% FRL); West Middle (math 17% / reading 33%, grade F, #321 of 391 statewide, top 82%, 730 students, 56% FRL); Hazelwood West High (math 16% / reading 42%, grade F, #407 of 521 statewide, top 78%, 2,042 students, 54% FRL) — zoned schools at 53% FRL track the district average.
- Market conditions: Rents rising fast (+4.3%/yr); 271 active listings in the ZIP; 19 comparable units currently listed for rent nearby; rentals at typical pace (median 26d on market — plan ~3-4 weeks tenant-placement turnaround); 920 units permitted in St. Louis County in 2024 (250 in 5+ unit buildings).
Forward outlook
- Local home prices are declining (-3.0%/yr); year-one equity from $1k of loan paydown is wiped out by about $6k of value loss. Plan a longer hold.
Negotiation context
- Only 5 days on market — expect competitive offers; lowballing is unlikely to land.
- 3 sale attempts since 15y ago with the ask held roughly flat each time — persistent listings suggest the price (not the market) is what's stuck; bring a comps-based counter.
- Current owner paid $167k; 23% above their basis — modest negotiation headroom, anchor on the comps not their cost.
Questions for the listing agent
- What do current leases actually rent for vs. the listed asking? Can we see a recent rent roll and the last 12 months of T-12 income?
- Built in 1962 — when were the roof, HVAC, electrical panel, plumbing, and water heater last replaced?
- Is there a deadline driving the sale (1031 exchange, divorce, estate, relocation)? That informs how much negotiation room exists.
- Schools are D-rated, which usually means shorter tenancies and higher turnover. Who's the typical renter profile here, and what's been the actual vacancy rate?
- The area grade is low — what's the realistic commute time and amenity access for the typical tenant pool here? Any planned neighborhood developments (good or bad) we should know about?
- What's the average days-on-market for RENTAL listings here right now (not sales)? A rising rental-DOM trend means longer vacancies and softer asking-rent achievability than the comps imply.
- What's the recent tenant-quality profile in this submarket — average credit score on applications, eviction rate, late-payment / NSF rate, and stable-employment percentage? A property-management company in the area should have these aggregated.
- How much new for-sale + rental construction is in the pipeline within 1–3 miles? Heavy new supply typically softens prices + rents 12–24 months out; constrained supply supports both.
Investment metrics
- 1% rule
- 0.68% ✗
- Cap rate
- 4.79%
- Cash-on-cash
- -5.37%
- DSCR
- 0.76
- GRM
- 12.3
CMA / ARV
- ARV (on-the-fly)
- $167,300
- Comps found
- 12
Show comp detail 12 sales within ~0.75 mi
| Address | Dist | Beds/Ba | Sqft | Sold | Price | $/sf | Match |
|---|---|---|---|---|---|---|---|
| 1782 Oliveto Ln | 0.15mi | 3/2.0 | 950 (-1%) | 3mo | $209,000 | $220 | 90 |
| 1520 Tahoe Dr | 0.14mi | 3/1.0 | 956 (0%) | 6mo | $139,900 | $146 | 84 |
| 10 Garnier Ct | 0.53mi | 3/1.5 | 960 (+0%) | 3mo | $125,000 | $130 | 70 |
| 7443 Foxfield Dr | 0.48mi | 3/1.0 | 974 (+2%) | 2mo | $169,990 | $175 | 69 |
| 1890 Caposele Ln | 0.34mi | 3/1.0 | 1,025 (+7%) | 5mo | $175,000 | $171 | 64 |
| 518 Fox Crest Dr | 0.65mi | 3/2.0 | 974 (+2%) | 5mo | $160,000 | $164 | 63 |
| 575 Candle Light Ln | 0.57mi | 3/1.5 | 987 (+3%) | 6mo | $195,000 | $198 | 61 |
| 1035 Kostka Ln | 0.56mi | 3/1.0 | 912 (-5%) | 2mo | $175,000 | $192 | 60 |
| 7240 Howdershell | 0.41mi | 4/2.0 (+1) | 1,032 (+8%) | 4mo | $130,000 | $126 | 59 |
| 6902 Howdershell Rd | 0.75mi | 3/1.0 | 960 (+0%) | 4mo | $150,000 | $156 | 57 |
| 608 Holiday Ave | 0.68mi | 3/1.0 | 912 (-5%) | 3mo | $165,000 | $181 | 54 |
| 1065 Keeven Ln | 0.75mi | 3/1.0 | 888 (-7%) | 1mo | $198,575 | $224 | 48 |
Match score weights: distance 35% · size 25% · config 20% · recency 20%. Top-matched comps best support the ARV.
Projected returns pro-forma
-3.0% appreciation · 4.27% rent growth · sell at horizon
- IRR
- -24.2%
- Equity multiple
- 0.17×
- Total profit
- $-47,772
- Equity at exit
- $30,551
- IRR
- -16.4%
- Equity multiple
- 0.04×
- Total profit
- $-55,147
- Equity at exit
- $17,716
Cash invested: $57,372 (down + closing). Projections, not guarantees.
Landlord ↔ Tenant lean methodology
- Overall (STATE)
- 81 Strongly Landlord-Friendly
- State Missouri
- 81 Strongly Landlord-Friendly · R+10
- County
- — inherits STATE
- City
- — inherits STATE
ZIP-level market 63031
- Rents YoY
- 4.3%
- Active inventory
- 271
- Price-to-rent
- 12.3×
Monthly cashflow live
- Estimated rent
- $1,390 high interval (Pro) →
- Mortgage (P&I)
- −$1,075
- Tax from tax record
- −$195 /mo · $2,338/yr
- Insurance
- −$85
- HOA
- −$0
- Vacancy / Maint / Mgmt
- −$292
- Net cashflow
- $-257
Break-even live
Sensitivity live
| Price | -10% $-141 | -5% $-199 | +0% $-257 | +5% $-315 | +10% $-373 |
|---|---|---|---|---|---|
| Rent | -10% $-367 | -5% $-312 | +0% $-257 | +5% $-202 | +10% $-147 |
| Rate | -1.0pp $-154 | -0.5pp $-205 | base $-257 | +0.5pp $-310 | +1.0pp $-364 |
UW: 25.0% down · 7.5% · 30yr · 1.5% tax · 5.0% vac · 8.0% maint · 8.0% mgmt
Financing live
Cash to close
- Down payment
- $51,225
- Closing costs
- $6,147
- Reserves months
- —
- Total cash needed
- —
Loan-product check · same deal, 3 products live
Conventional
25% down · 7.5% · 30yr
- Down + closing
- —
- Monthly P&I
- —
- Monthly cashflow
- —
- DSCR
- —
- Eligible?
- —
Personal DTI + credit; lowest rate.
DSCR
20% down · 8.5% · 30yr
- Down + closing
- —
- Monthly P&I
- —
- Monthly cashflow
- —
- DSCR
- —
- Eligible?
- —
No personal income docs; deal must DSCR.
Hard money
10% down · 12.0% · 12mo
- Down + closing
- —
- Monthly P&I
- —
- Monthly cashflow
- —
- DSCR
- —
- Eligible?
- —
Short-term bridge; refi at stabilization.
Rent comps 19 comps
| Address | Beds | Baths | Sqft | Rent | $/sqft | DOM | Units | Dist |
|---|---|---|---|---|---|---|---|---|
| 7323 Landi Ct Hazelwood, MO | 3.0 | 1.5 | 1032 | $1,495 | $1.45 | 0d | 1 | 0.29mi |
| 858 Hazelvalley Dr Hazelwood, MO | 3.0 | 1.5 | 912 | $1,450 | $1.59 | 45d | 1 | 0.55mi |
| 446 Olian Dr Hazelwood, MO | 2.0 | 1.0 | 880 | $975 | $1.11 | 3d | 1 | 0.76mi |
| 7404 Olian Dr Hazelwood, MO | 2.0 | 1.0 | 870 | $925 | $1.06 | 45d | 1 | 0.81mi |
| 532 Holiday Ave Hazelwood, MO | 3.0 | 1.0 | 912 | $1,350 | $1.48 | 45d | 1 | 0.81mi |
| 2280 Keeven Ln Florissant, MO | 1.0–3.0 | 1.0–1.5 | 805 | $1,290 | $1.60 | 0d | 14 | 0.84mi |
| 785 Florland Dr Florissant, MO | 3.0 | 1.0 | 1100 | $1,700 | $1.55 | 19d | 1 | 0.86mi |
| 1052 Teson Rd Unit 1064D Hazelwood, MO | 2.0 | 1.0 | 800 | $1,000 | $1.25 | 45d | 1 | 0.87mi |
| 1052 Teson Rd Unit 1068D Hazelwood, MO | 2.0 | 1.0 | 800 | $1,000 | $1.25 | 18d | 1 | 0.87mi |
| 1052 Teson Rd Unit 1048A Hazelwood, MO | 2.0 | 1.0 | 800 | $995 | $1.24 | 45d | 1 | 0.87mi |
| 508 Saratoga Ln Hazelwood, MO | 3.0 | 1.0 | 988 | $1,306 | $1.32 | 25d | 1 | 0.89mi |
| 651 Southwell Ln Florissant, MO | 2.0 | 1.0 | 694 | $1,100 | $1.59 | 19d | 1 | 0.98mi |
| 1015 Lindsay Ln Florissant, MO | 3.0 | 2.0 | 988 | $1,600 | $1.62 | 25d | 1 | 1.20mi |
| 14 Bruce Dr Unit Bruce 14-4 Florissant, MO | 2.0 | 1.0 | 880 | $975 | $1.11 | 45d | 1 | 1.23mi |
| 13 Bruce Dr Unit Bruce 13-2 Florissant, MO | 2.0 | 1.0 | 880 | $975 | $1.11 | 45d | 1 | 1.24mi |
| 13 Bruce Dr Florissant, MO | 2.0 | 1.0 | 880 | $975 | $1.11 | 25d | 1 | 1.24mi |
| 2485 Jenkee Dr Florissant, MO | 3.0 | 1.0 | 960 | $1,376 | $1.43 | 0d | 1 | 1.28mi |
| 1540 Aspen Dr Florissant, MO | 3.0 | 2.0 | 912 | $1,395 | $1.53 | 0d | 1 | 1.46mi |
| 1540 Aspen Dr Florissant, MO | 3.0 | 2.0 | 912 | $1,395 | $1.53 | 9d | 1 | 1.46mi |
Listing history 4 events
-
2026-06-21days on market $204,900 Active 5 DOM
-
2026-06-18days on market $204,900 Active 2 DOM
-
2026-06-17remarks 699-char remark
-
2026-06-17$204,900 Active 1 DOM
ⓘ Source: listings_history table (triggers on properties + properties_extension) + one-shot
backfill from property_details.listing_events for pre-trigger history.
Tax reassessment forecast MO · Resets to sale price
- Current annual tax
- $2,338 · $195/mo
- Projected year-2 tax
- $2,338 · $195/mo
- Expected delta
- $0/yr ($0/mo · 0.0%)
ⓘ Screening estimate from a state-policy table — verify with the county assessor before closing.
Climate risk First Street
- Flood 1/10 Low FEMA zone X (unshaded) · 0% chance over 30 yrs
- Wildfire 1/10 Low
- Heat 4/10 Moderate 7 d/yr ≥106°F today · 21 d/yr by 30 yrs out
- Wind 2/10 Low 100% chance of damaging wind over 30 yrs
- Air quality 2/10 Low 2 unhealthy d/yr today · 2 by 30 yrs out
Nearby sold comps map
Loading sold comps map…
Walkable amenities ~0.75 mi
Loading nearby amenities…
Taxation est. · year 1
- Rental income
- $16,679
- − Mortgage interest
- −$11,478
- − Property taxes
- −$2,338
- − Insurance
- −$1,024
- − Repairs & maintenance
- −$1,334
- − Management
- −$1,334
- − Depreciation
- −$5,961
- Taxable loss
- −$6,791
- Est. tax savings @ 24.0%
- +$1,630
- After-tax cash flow
- $-1,451/yr
For passive investors: Depreciation is non-cash, so a rental often shows a tax loss while cash-flowing — sheltering income. Rental losses are passive: they offset passive income freely, and up to $25,000/yr can offset ordinary (W-2) income if you actively participate and your MAGI is under $100k (phasing out to $0 by $150k); unused losses carry forward. On sale, claimed depreciation is recaptured at up to 25%, and gains may owe capital-gains tax (a 1031 exchange can defer both). Figures are a year-1 estimate at your 24.0% rate — not tax advice; consult a CPA.
Schools (NCES district)
- District
- Hazelwood
- NCES district ID
- 2913830
- Math proficiency
- 11% ▼ -13.00%
- Reading proficiency
- 26% ▼ -6.00%
- Median HH income
- $51,621
- Composite
- 16.77/100
- National rank
- #9156
- State rank
- #306 of 324 in MO
Livability — Florissant
- Score
- 73/100
- State rank
- #82
- US rank
- #5406
Category grades
Schools grade is shown separately in the Schools card above.
Census & demographics
- Census place
- Florissant, MO
- County
- Saint Louis County · 888,823 people
- City population
- 69,104
- Metro
- St. Louis, MO-IL
- Population (ZIP)
- 50,196
- Household income
- $70,811
- Rent vs Own
- Severe rent burden
- 1279.0
Population outlook (St. Louis County) Hauer SSP2
- Today (2025)
- 1,025,227 people
- By 2030
- 1,028,023 · +0.3%
- By 2040
- 1,020,940 · -0.4%
- By 2050
- 1,007,280 · -1.8%
- By 2075
- 987,277 · -3.7%
- By 2100
- 921,984 · -10.1%
Race, ethnicity, and origin ACS 2023
- Neighborhood character
- Diverse neighborhood (Simpson 0.58)
- Race & ethnicity
- White 49% Black 41% Two or more races 7% Hispanic / Latino 2%
- Common ancestry
- Romanian 3% Lithuanian 3% Swedish 1%
- Foreign-born
- 5% · Canada, Jamaica
- Languages at home
- 94% English-only · Spanish 2% Arabic 1%
Political lean MEDSL · St. Louis
- 2024 margin
- Strong D (+23.4) · D 60.8% · R 37.4% · Other 1.7%
- 2008→2024 swing
- +3.5pp toward D · 2008: 19.9pp · 2024: 23.4pp
- All cycles
- 2024: D+23.4 2020: D+24.0 2016: D+16.2 2012: D+13.7 2008: D+19.9
Not yet ingested
- Civics
- —
Market trends
- HPI YoY
- ▼ -223.57%
- Current HPI
- 202.7192
- Rent YoY
- ▲ 4.27%
- Metro
- St. Louis, MO-IL
- State GDP YoY
- ▲ 1.84%
- F500 in state
- 20
Industry mix (Fortune 500 HQ in MO)
| Industry | F500 HQs | Revenue |
|---|---|---|
| Healthcare | 1 | $163B |
|
||
| Insurance | 1 | $21B |
|
||
| Industrial Technology | 1 | $17B |
|
||
| Retail | 1 | $16B |
|
||
| Industrial Distribution | 1 | $10B |
|
||
| Utilities | 1 | $9B |
|
||
Price history
+90.6% since first listed13 events — show timeline
- 2026-06-16 Listed $204,900 MARIS as Distributed by MLS Grid
- 2022-12-24 Rental Removed — RENT.
- 2021-11-15 Sold (Public Records) $167,000 Public Records
- 2021-11-03 Sold (MLS) — MARIS as Distributed by MLS Grid
- 2021-10-07 Pending — MARIS as Distributed by MLS Grid
- 2021-10-07 Listed $149,999 MARIS as Distributed by MLS Grid
- 2021-10-05 Coming Soon $149,999 MARIS as Distributed by MLS Grid
- 2012-02-24 Sold (Public Records) $96,500 Public Records
- 2012-02-16 Sold (MLS) — MARIS as Distributed by MLS Grid
- 2011-11-09 Listed $99,900 MARIS as Distributed by MLS Grid
- 2010-10-18 Sold (Public Records) $95,578 Public Records
- 2006-04-05 Sold (Public Records) $107,500 Public Records
- 2006-04-05 Sold (Public Records) — Public Records
Property tax history
+4.3%/yrLatest (2022): $2,338 · +2.7% YoY. Source: county tax records.
Cash-flow waterfall
monthlySold comps — $/sqft
last 12 mo · ≤1 miLoading sold comps…