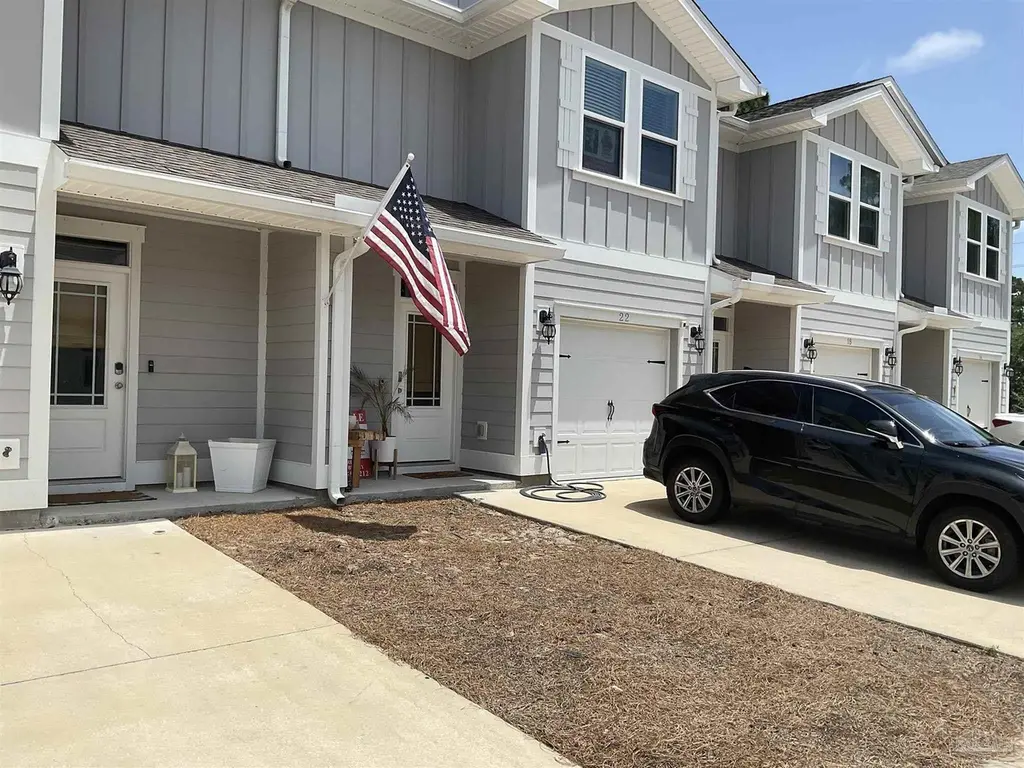
22 Sandhill Pines Dr
Miramar Beach, FL 32459
$375,000F
3 bd · 3.0 ba ·
1,456 sqft ·
Built 2021
· Townhouse
· Active
· 29 DOM
Cashflow @ list (25.0% down · 7.5%)
Estimated rent
$2,969/mo
Mortgage (P&I)
−$1,967
Tax + insurance
−$459
HOA
−$23
Vac / Maint / Mgmt
−$623
Net cashflow
$-103/mo
Annual
$-1,235/yr
Cap rate
6.18%
Cash-on-cash
-0.42%
DSCR
0.98
1% rule
0.79%
Cash to close
$105,000
Investor read
- This is a 3-bed/3.0-bath townhouse listed at $375k.
- At list price, monthly cash flow is $-103 ($-1k/yr) — negative.
- To cash-flow at today's rent, offer at most $357k (4.8% below list).
- To meet the 1% rule (rent ≥ 1% of price), the offer needs to be $297k (20.8% below list).
- It's been on market 29 days — a 2% lower offer ($369k) is reasonable based on typical stale-listing flexibility.
- Recommended offer: $297k (20.8% below list) — sets the bar for 1% rule.
- Local home prices are declining (-3.0%/yr); year-one equity from $3k of loan paydown is wiped out by about $11k of value loss. Plan a longer hold.
- Location reads 67/100 on livability (#569 in FL) — a middle-class / working-renter tenant base. Strengths: crime A+, housing A, employment A-; Watch: health & safety C-, schools D+, amenities F.
- Walton (rural): math 62% / reading 61% proficiency, ranked #10 of 73 in FL (top 14%) — acceptable for families but not a draw, mixed tenant base, ~2y average lease.
- Watch-outs: flood insurance adds $66/mo.
- Market conditions: Rents falling (-3.5%/yr); 1585 active listings in the ZIP; 10 comparable units currently listed for rent nearby; rentals at typical pace (median 22d on market — plan ~3-4 weeks tenant-placement turnaround); solid renter incomes; 2,883 units permitted in Walton County in 2024 (1,322 in 5+ unit buildings).
- Walton County population projected at +46% by 2050 — long-run rental-demand tailwind backs the buy-and-hold thesis.
- 4 sale attempts since 3y ago; this cycle's ask has dropped $25k (6%) from the opening price — seller is motivated, your offer sets the floor, not the list.
- Climate carrying-cost: severe flood risk; severe wind risk, 99% chance of damaging wind over 30y; extreme-heat days projected 7→22/yr by 2055 (HVAC capex compounding) — expect insurance premiums to compound above CPI over the hold.
- Cap rate 6.2% vs local median 1.1% in Miramar Beach — top-decile yield for the area; either an underpriced asset or a hidden risk that comps aren't pricing in. Stress-test before assuming the spread holds.
- This rent runs 33% of the median local income ($108k/yr) — at the standard rent-burdened threshold; future hikes will face affordability resistance.
Questions for listing agent
- What do current leases actually rent for vs. the listed asking? Can we see a recent rent roll and the last 12 months of T-12 income?
- What's the actual annual flood-insurance premium (NFIP or private), and is the property in a SFHA with mandatory coverage?
- What does the HOA fee cover, when was the last increase, and are there any pending special assessments or reserve-fund shortfalls?
- Is there a deadline driving the sale (1031 exchange, divorce, estate, relocation)? That informs how much negotiation room exists.
- Schools are D-rated, which usually means shorter tenancies and higher turnover. Who's the typical renter profile here, and what's been the actual vacancy rate?
- The area grade is low — what's the realistic commute time and amenity access for the typical tenant pool here? Any planned neighborhood developments (good or bad) we should know about?
- What's the average days-on-market for RENTAL listings here right now (not sales)? A rising rental-DOM trend means longer vacancies and softer asking-rent achievability than the comps imply.
- What's the recent tenant-quality profile in this submarket — average credit score on applications, eviction rate, late-payment / NSF rate, and stable-employment percentage? A property-management company in the area should have these aggregated.
CashFlowRE · CFR-QN02GS1DMNKHJB
· Data 2 days ago
cashflowre.app · 2026-05-29