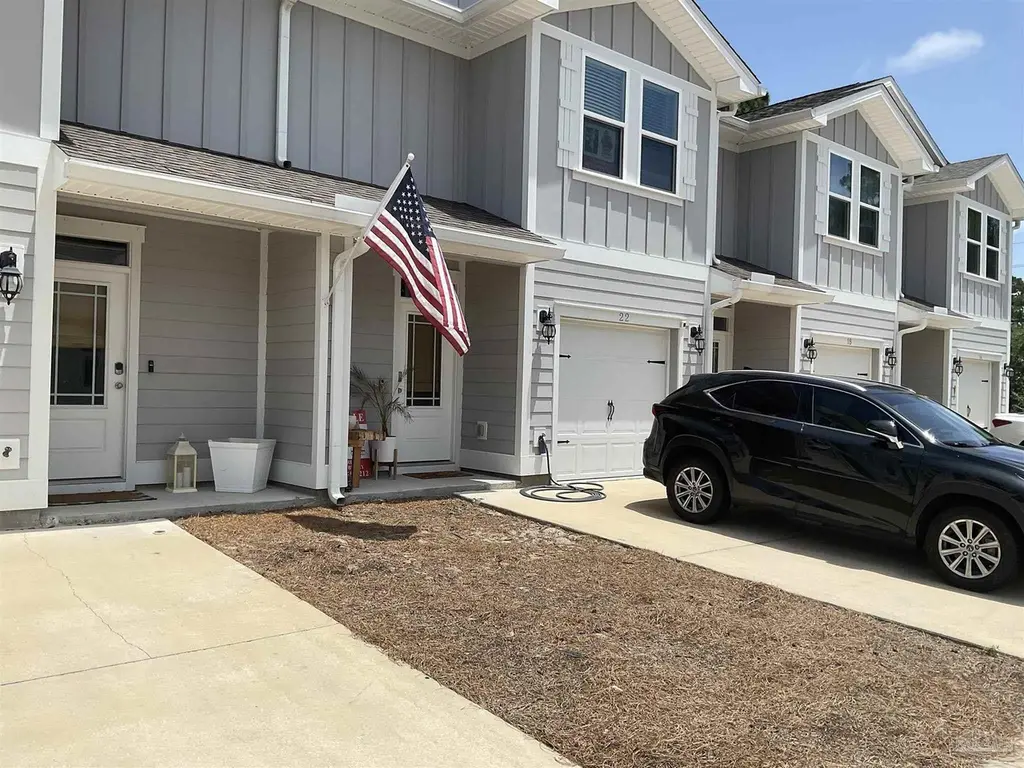
22 Sandhill Pines Dr · Miramar Beach, FL
Flood risk 8/10 · Major
- FEMA flood zone
- X (shaded)
- Chance of flooding over 30 yrs
- 0.99%
- Est. flood insurance / yr
- $507 – $1,088
Fire risk 3/10 · Minor
- Est. fire insurance / yr
- $947 – $1,759
Heat risk 10/10 · Severe
- Hot days now (above 104°F)
- 7 days/yr
- Hot days in 30 yrs
- 22 days/yr
Wind risk 9/10 · Severe
- Chance of severe wind over 30 yrs
- 99.0%
Air-quality risk 2/10 · Minimal
- Unhealthy air days now
- 0 days/yr
- Unhealthy air days in 30 yrs
- 1 days/yr
Risk factors via First Street. Map © Google.
Why this score? — see what drove the F grade
The composite is a weighted blend of 9 inputs, each scored 0–100. Each bar is that input's sub-score; the figure is the points it added to the 100-point composite (weight × sub-score).
- Cash flow +12.8/30.0
- Schools +5.2/10.0
- DSCR +3.8/10.0
- Livability +3.4/5.0
- 1% rule +2.9/10.0
- Condition / age +2.5/5.0
- Rent growth +1.6/5.0
- ARV discount +0.0/15.0
- Appreciation +0.0/10.0
$375,000
🖨 Deal sheet 📄 Offer letter ✓ Due diligence
Listing remarks
Introducing 22 Sandhill Pines, a townhome nestled just minutes from the pristine beaches of Florida's Emerald Coast. Built in 2021, this 3-bedroom, 2.5-bathroom residence has been meticulously maintained by its original owners. It boasts granite countertops and ivory colored shaker style cabinetry , LVP flooring throughout, and dual vanities in the master bathroom, complemented by brushed nickel hardware and stainless-steel appliances. Ideal as a primary home or investment property, it features a one-car garage and a private deck with serene views of a wooded area. The HOA is tasked with landscaping, exterior upkeep, and trash removal. Only 1.1 miles off Hwt 98 and Sacred Heart Hospital plu
Key facts
- Evp flooring
- Granite countertops
- $23 HOA
Tags
Property features AI
Finance
- Other: County-maintained road access
- HOA & community: HOA present with an annual fee of $275 (covers association)
Exterior
- Parking: Attached garage with one covered space; Garage door opener; Total of 1 parking space
- Utilities: Public water; Public sewer; Electric with circuit breakers and copper wiring; Cable available
- Home design: Attached property; Two levels; Resale (built prior to listing); Frame construction
- Construction: Frame construction; Slab foundation; Two-story
- Exterior features: Interior lot; Shingle roof; Insulated walls; Ridge vent
Interior
- Kitchen: Updated kitchen with granite counters; Built-in microwave; Microwave; Self-cleaning oven; Gas or electric range not specified; Dishwasher; Garbage disposal; Refrigerator
- Bedrooms: Primary suite approximately 15.5 x 15.5 on second level; Additional bedrooms on second level (approx. 13.7 x 9.4)
- Flooring: Carpet; Laminate
- Bathrooms: Two full bathrooms; One half bathroom; Bathrooms updated within last 1–5 years; Granite countertops and shaker-style cabinetry with brushed nickel hardware in recent updates
- Heating & cooling: Central heating; Central air conditioning
- Interior features: Baseboards; Recessed lighting; Double-pane windows; Window blinds
- Laundry & utility: Washer; Dryer; Electric water heater
Neighborhood map
What this means for you Summary
Snapshot
- This is a 3-bed/3.0-bath townhouse listed at $375k.
Deal economics
- At list price, monthly cash flow is $-103 ($-1k/yr) — negative.
- To cash-flow at today's rent, offer at most $357k (4.8% below list).
- To meet the 1% rule (rent ≥ 1% of price), the offer needs to be $297k (20.8% below list).
- Recommended offer: $297k (20.8% below list) — sets the bar for 1% rule.
- Cap rate 6.2% vs local median 1.1% in Miramar Beach — top-decile yield for the area; either an underpriced asset or a hidden risk that comps aren't pricing in. Stress-test before assuming the spread holds.
Location & tenants
- Location reads 67/100 on livability (#569 in FL) — a middle-class / working-renter tenant base. Strengths: crime A+, housing A, employment A-; Watch: health & safety C-, schools D+, amenities F.
- Walton (rural): math 62% / reading 61% proficiency, ranked #10 of 73 in FL (top 14%) — acceptable for families but not a draw, mixed tenant base, ~2y average lease.
- Market conditions: Rents falling (-3.5%/yr); 1585 active listings in the ZIP; 10 comparable units currently listed for rent nearby; rentals at typical pace (median 22d on market — plan ~3-4 weeks tenant-placement turnaround); solid renter incomes; 2,883 units permitted in Walton County in 2024 (1,322 in 5+ unit buildings).
- This rent runs 33% of the median local income ($108k/yr) — at the standard rent-burdened threshold; future hikes will face affordability resistance.
Forward outlook
- Local home prices are declining (-3.0%/yr); year-one equity from $3k of loan paydown is wiped out by about $11k of value loss. Plan a longer hold.
- Walton County population projected at +46% by 2050 — long-run rental-demand tailwind backs the buy-and-hold thesis.
Negotiation context
- It's been on market 29 days — a 2% lower offer ($369k) is reasonable based on typical stale-listing flexibility.
- 4 sale attempts since 3y ago; this cycle's ask has dropped $25k (6%) from the opening price — seller is motivated, your offer sets the floor, not the list.
Risks & watch-outs
- Watch-outs: flood insurance adds $66/mo.
- Climate carrying-cost: severe flood risk; severe wind risk, 99% chance of damaging wind over 30y; extreme-heat days projected 7→22/yr by 2055 (HVAC capex compounding) — expect insurance premiums to compound above CPI over the hold.
Questions for the listing agent
- What do current leases actually rent for vs. the listed asking? Can we see a recent rent roll and the last 12 months of T-12 income?
- What's the actual annual flood-insurance premium (NFIP or private), and is the property in a SFHA with mandatory coverage?
- What does the HOA fee cover, when was the last increase, and are there any pending special assessments or reserve-fund shortfalls?
- Is there a deadline driving the sale (1031 exchange, divorce, estate, relocation)? That informs how much negotiation room exists.
- Schools are D-rated, which usually means shorter tenancies and higher turnover. Who's the typical renter profile here, and what's been the actual vacancy rate?
- The area grade is low — what's the realistic commute time and amenity access for the typical tenant pool here? Any planned neighborhood developments (good or bad) we should know about?
- What's the average days-on-market for RENTAL listings here right now (not sales)? A rising rental-DOM trend means longer vacancies and softer asking-rent achievability than the comps imply.
- What's the recent tenant-quality profile in this submarket — average credit score on applications, eviction rate, late-payment / NSF rate, and stable-employment percentage? A property-management company in the area should have these aggregated.
- How much new for-sale + rental construction is in the pipeline within 1–3 miles? Heavy new supply typically softens prices + rents 12–24 months out; constrained supply supports both.
Investment metrics
- 1% rule
- 0.79% ✗
- Cap rate
- 6.18%
- Cash-on-cash
- -0.42%
- DSCR
- 0.98
- GRM
- 10.5
CMA / ARV
- ARV (on-the-fly)
- $298,480
- Comps found
- 7
Show comp detail 7 sales within ~0.75 mi
| Address | Dist | Beds/Ba | Sqft | Sold | Price | $/sf | Match |
|---|---|---|---|---|---|---|---|
| 187 Sandhill Pines Dr | 0.15mi | 3/2.5 | 1,456 (0%) | 6mo | $325,000 | $223 | 86 |
| 183 Sandhill Pines Dr | 0.15mi | 3/2.5 | 1,537 (+6%) | 8mo | $315,000 | $205 | 75 |
| 42 Sandy Cove Way | 0.22mi | 3/2.5 | 1,553 (+7%) | 11mo | $313,370 | $202 | 67 |
| 732 E Mack Bayou Dr #9 | 0.32mi | 3/2.5 | 1,527 (+5%) | 15mo | $270,000 | $177 | 63 |
| 2323 Crystal Cove Ln #2323 | 0.59mi | 3/3.0 | 1,378 (-5%) | 3mo | $475,000 | $345 | 62 |
| 732 E Mack Bayou Dr #1 | 0.32mi | 3/2.5 | 1,527 (+5%) | 22mo | $295,000 | $193 | 57 |
| 234 S Blue Heron Dr #4 | 0.54mi | 2/2.5 (-1) | 1,600 (+10%) | 14mo | $675,000 | $422 | 40 |
Match score weights: distance 35% · size 25% · config 20% · recency 20%. Top-matched comps best support the ARV.
Projected returns pro-forma
-3.0% appreciation · 0.0% rent growth · sell at horizon
- IRR
- -21.5%
- Equity multiple
- 0.28×
- Total profit
- $-76,066
- Equity at exit
- $55,914
- IRR
- -23.8%
- Equity multiple
- -0.03×
- Total profit
- $-108,477
- Equity at exit
- $32,423
Cash invested: $105,000 (down + closing). Projections, not guarantees.
Landlord ↔ Tenant lean methodology
- Overall (STATE)
- 87 Strongly Landlord-Friendly
- State Florida
- 87 Strongly Landlord-Friendly · R+3
- County
- — inherits STATE
- City
- — inherits STATE
ZIP-level market 32459
- Home prices YoY
- -19.8%
- Rents YoY
- -3.5%
- Active inventory
- 1585
- Price-to-rent
- 10.5×
Monthly cashflow live
- Estimated rent
- $2,969 high interval (Pro) →
- Mortgage (P&I)
- −$1,967
- Tax from tax record
- −$236 /mo · $2,831/yr
- Insurance
- −$156
- Flood insurance flood zone
- −$66 /mo · $798/yr
- HOA
- −$23
- Vacancy / Maint / Mgmt
- −$623
- Net cashflow
- $-103
Break-even live
UW: 25.0% down · 7.5% · 30yr · 1.5% tax · 5.0% vac · 8.0% maint · 8.0% mgmt
Financing live
Cash to close
- Down payment
- $93,750
- Closing costs
- $11,250
- Reserves months
- —
- Total cash needed
- —
Loan-product check · same deal, 3 products live
Conventional
25% down · 7.5% · 30yr
- Down + closing
- —
- Monthly P&I
- —
- Monthly cashflow
- —
- DSCR
- —
- Eligible?
- —
Personal DTI + credit; lowest rate.
DSCR
20% down · 8.5% · 30yr
- Down + closing
- —
- Monthly P&I
- —
- Monthly cashflow
- —
- DSCR
- —
- Eligible?
- —
No personal income docs; deal must DSCR.
Hard money
10% down · 12.0% · 12mo
- Down + closing
- —
- Monthly P&I
- —
- Monthly cashflow
- —
- DSCR
- —
- Eligible?
- —
Short-term bridge; refi at stabilization.
Rent comps 10 comps
| Address | Beds | Baths | Sqft | Rent | $/sqft | DOM | Units | Dist |
|---|---|---|---|---|---|---|---|---|
| 44 Sandhill Pines Dr Lot 53 Santa Rosa Beach, FL | 3.0 | 2.5 | 1456 | $3,150 | $2.16 | 21d | 1 | 0.03mi |
| 2469 Bungalo Ln Unit 1354366P Miramar Beach, FL | 3.0 | 3.5 | 1668 | $4,498 | $2.70 | 14d | 1 | 0.20mi |
| 12 Sandy Cove Way Unit 1468396P SANTA RSA BCH, FL | 3.0 | 2.5 | 1689 | $3,093 | $1.83 | 21d | 1 | 0.20mi |
| 980 Mack Bayou Rd #14 Santa Rosa Beach, FL | 2.0 | 2.0 | 900 | $1,650 | $1.83 | 14d | 1 | 0.31mi |
| 980 Mack Bayou Rd #8 Santa Rosa Beach, FL | 2.0 | 2.0 | 900 | $1,600 | $1.78 | 14d | 1 | 0.31mi |
| 31 Rearden Way Santa Rosa Beach, FL | 3.0 | 3.0 | 1870 | $2,850 | $1.52 | 21d | 1 | 0.47mi |
| 15 Blue Cove Dr Santa Rosa Beach, FL | 1.0–3.0 | 1.0–2.5 | 1075 | $2,677 | $2.49 | 14d | 23 | 0.53mi |
| 647 Goldsby Rd Santa Rosa Beach, FL | 1.0–3.0 | 1.0–3.0 | 1002 | $2,940 | $2.93 | 14d | 25 | 0.98mi |
| 17 Bald Eagle Ct Santa Rosa Beach, FL | 3.0 | 2.5 | 1588 | $2,195 | $1.38 | 21d | 1 | 1.33mi |
| 9000 Heron Walk Dr E #3204 Miramar Beach, FL | 3.0 | 3.0 | 1570 | $4,100 | $2.61 | 21d | 1 | 1.48mi |
HOA detail
- Monthly dues
- $23 · $276/yr
- Likely covers
- trashlandscaping
Listing history 25 events
-
2026-06-18days on market $375,000 Active 29 DOM
-
2026-06-17pricedays on market $375,000 Active 28 DOM
-
2026-06-16days on market $399,720 Active 27 DOM
-
2026-06-15days on market $399,720 Active 26 DOM
-
2026-06-14days on market $399,720 Active 24 DOM
-
2026-06-13days on market $399,720 Active 23 DOM
-
2026-06-10days on market $399,720 Active 21 DOM
-
2026-06-09days on market $399,720 Active 20 DOM
-
2026-06-08days on market $399,720 Active 19 DOM
-
2026-06-07days on market $399,720 Active 18 DOM
-
2026-06-05days on market $399,720 Active 15 DOM
-
2026-06-03days on market $399,720 Active 14 DOM
-
2026-06-02days on market $399,720 Active 13 DOM
-
2026-06-01days on market $399,720 Active 12 DOM
-
2026-05-31days on market $399,720 Active 11 DOM
-
2026-05-30days on market $399,720 Active 10 DOM
-
2026-05-20$399,720 Active
-
2024-10-21historical $2,400
-
2024-06-26$2,400
-
2024-06-25price $355,000
-
2024-05-10historical $2,700
-
2024-05-07$2,700
-
2023-12-01price $399,000
-
2023-11-14price $419,000
-
2023-09-22$429,000 Active
ⓘ Source: listings_history table (triggers on properties + properties_extension) + one-shot
backfill from property_details.listing_events for pre-trigger history.
Tax reassessment forecast FL · Resets to sale price
- Current annual tax
- $2,831 · $236/mo
- Projected year-2 tax
- $3,112 · $259/mo
- Expected delta
- +$281/yr (+$23/mo · 9.9%)
ⓘ Screening estimate from a state-policy table — verify with the county assessor before closing.
Climate risk First Street
- Flood 8/10 Severe FEMA zone X (shaded) · 99% chance over 30 yrs
- Wildfire 3/10 Moderate
- Heat 10/10 Extreme 7 d/yr ≥104°F today · 22 d/yr by 30 yrs out
- Wind 9/10 Extreme 99% chance of damaging wind over 30 yrs
- Air quality 2/10 Low 0 unhealthy d/yr today · 1 by 30 yrs out
Nearby sold comps map
Loading sold comps map…
Walkable amenities ~0.75 mi
Loading nearby amenities…
Taxation est. · year 1
- Rental income
- $35,624
- − Mortgage interest
- −$21,006
- − Property taxes
- −$2,831
- − Insurance
- −$2,672
- − Repairs & maintenance
- −$2,850
- − Management
- −$2,850
- − HOA
- −$276
- − Depreciation
- −$10,909
- Taxable loss
- −$7,771
- Est. tax savings @ 24.0%
- +$1,865
- After-tax cash flow
- $630/yr
For passive investors: Depreciation is non-cash, so a rental often shows a tax loss while cash-flowing — sheltering income. Rental losses are passive: they offset passive income freely, and up to $25,000/yr can offset ordinary (W-2) income if you actively participate and your MAGI is under $100k (phasing out to $0 by $150k); unused losses carry forward. On sale, claimed depreciation is recaptured at up to 25%, and gains may owe capital-gains tax (a 1031 exchange can defer both). Figures are a year-1 estimate at your 24.0% rate — not tax advice; consult a CPA.
Schools (NCES district)
- District
- Walton
- NCES district ID
- 1201980
- Math proficiency
- 62% ▼ -4.00%
- Reading proficiency
- 61% ▼ -2.00%
- Median HH income
- $46,794
- Composite
- 52.03/100
- National rank
- #1634
- State rank
- #10 of 73 in FL
Livability — Miramar Beach
- Score
- 67/100
- State rank
- #569
- US rank
- #10855
Category grades
Schools grade is shown separately in the Schools card above.
Census & demographics
- Census place
- Miramar Beach, FL
- County
- Walton County · 70,839 people
- City population
- 8,486
- Metro
- Crestview-Fort Walton Beach-Destin, FL
- Population (ZIP)
- 23,522
- Household income
- $107,821
- Rent vs Own
- Severe rent burden
- 633.0
Population outlook (Walton County) Hauer SSP2
- Today (2025)
- 80,014 people
- By 2030
- 88,120 · +10.1%
- By 2040
- 103,537 · +29.4%
- By 2050
- 117,034 · +46.3%
- By 2075
- 143,901 · +79.8%
- By 2100
- 155,138 · +93.9%
Race, ethnicity, and origin ACS 2023
- Neighborhood character
- Predominantly White (84%)
- Race & ethnicity
- White 84% Hispanic / Latino 8% Two or more races 5% Asian 3%
- Hispanic origin (detail)
- Mexican 3% Puerto Rican 2% Cuban 1%
- Common ancestry
- Italian 3% Lithuanian 2% Slovak 2%
- Foreign-born
- 11% · Canada, China, Jamaica
- Languages at home
- 91% English-only · Spanish 4% Russian/Polish/Slavic 2% Other Indo-European 1%
Political lean MEDSL · Walton
- 2024 margin
- Solid R (+57.8) · D 20.7% · R 78.6%
- 2008→2024 swing
- -12.0pp toward R · 2008: -45.8pp · 2024: -57.8pp
- All cycles
- 2024: R+57.8 2020: R+51.7 2016: R+56.1 2012: R+52.0 2008: R+45.8
Not yet ingested
- Civics
- —
Market trends
- HPI YoY
- ▼ -91.08%
- Current HPI
- 368.4091
- Rent YoY
- ▼ -3.45%
- Metro
- Crestview-Fort Walton Beach-Destin, FL
- State GDP YoY
- ▲ 3.28%
- F500 in state
- 36
Industry mix (Fortune 500 HQ in FL)
| Industry | F500 HQs | Revenue |
|---|---|---|
| Industrial Technology | 2 | $29B |
|
||
| Insurance | 2 | $17B |
|
||
| Retail | 1 | $60B |
|
||
| Technology Distribution | 1 | $58B |
|
||
| Homebuilding | 1 | $35B |
|
||
| Technology Manufacturing | 1 | $35B |
|
||
Price history
-6.8% since first listed9 events — show timeline
- 2026-05-20 Listed $399,720 PARMLS
- 2024-10-21 Rental Removed $2,400 ECAR
- 2024-06-26 Listed for Rent $2,400 ECAR
- 2024-06-25 Price Changed $355,000 ECAR
- 2024-05-10 Rental Removed $2,700 ECAR
- 2024-05-07 Listed for Rent $2,700 ECAR
- 2023-12-01 Price Changed $399,000 ECAR
- 2023-11-14 Price Changed $419,000 ECAR
- 2023-09-22 Listed $429,000 ECAR
Property tax history
+155.2%/yrLatest (2025): $2,831 · -2.6% YoY. Source: county tax records.
Cash-flow waterfall
monthlySold comps — $/sqft
last 12 mo · ≤1 miLoading sold comps…