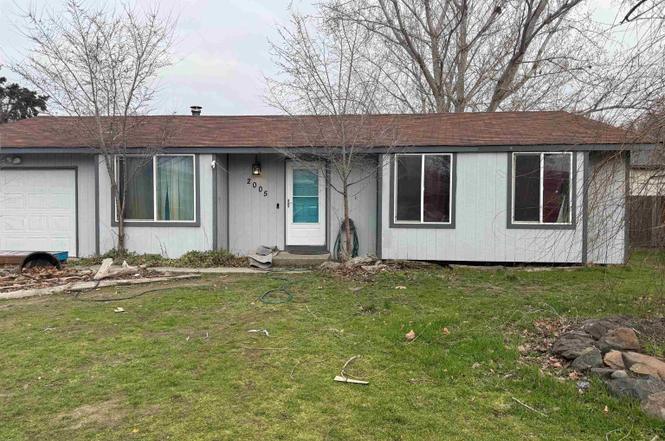
2005 S Tacoma St
Kennewick, WA 99337
$258,900D
3 bd · 2.0 ba ·
1,184 sqft ·
Built 1979
· SingleFamily
· Pending
· 22 DOM
Cashflow @ list (25.0% down · 7.5%)
Estimated rent
$1,820/mo
Mortgage (P&I)
−$1,358
Tax + insurance
−$287
HOA
−$0
Vac / Maint / Mgmt
−$382
Net cashflow
$-207/mo
Annual
$-2,483/yr
Cap rate
5.33%
Cash-on-cash
-3.42%
DSCR
0.85
1% rule
0.70%
Cash to close
$72,492
Investor read
- This is a 3-bed/2.0-bath single-family listed at $259k.
- At list price, monthly cash flow is $-207 ($-2k/yr) — negative.
- To cash-flow at today's rent, offer at most $222k (14.1% below list).
- To meet the 1% rule (rent ≥ 1% of price), the offer needs to be $182k (29.7% below list).
- It's been on market 22 days — a 2% lower offer ($255k) is reasonable based on typical stale-listing flexibility.
- Recommended offer: $182k (29.7% below list) — sets the bar for 1% rule.
- Local home prices are declining (-3.0%/yr); year-one equity from $2k of loan paydown is wiped out by about $8k of value loss. Plan a longer hold.
- Location reads 78/100 on livability (#131 in WA, #2,599 nationally) — a middle-class / working-renter tenant base. Strengths: commute A+, housing A+, health & safety A; Watch: amenities D+, crime F.
- Kennewick School District (urban): math 43% / reading 58% proficiency, ranked #141 of 291 in WA (top 48%) — acceptable for families but not a draw, mixed tenant base, ~2y average lease.
- Zoned schools: Canyon View Elementary School (406 students, 68% FRL); Horse Heaven Hills Middle School (833 students, 65% FRL); Southridge High School (1,641 students, 55% FRL).
- Market conditions: 249 active listings in the ZIP; 40 comparable units currently listed for rent nearby; rentals at typical pace (median 23d on market — plan ~3-4 weeks tenant-placement turnaround); solid renter incomes; 1,532 units permitted in Benton County in 2024 (389 in 5+ unit buildings).
- Benton County population projected at +32% by 2050 — long-run rental-demand tailwind backs the buy-and-hold thesis.
- 3 sale attempts since 23y ago with the ask held roughly flat each time — persistent listings suggest the price (not the market) is what's stuck; bring a comps-based counter.
- Cap rate 5.3% vs local median 3.3% in Kennewick — top-decile yield for the area; either an underpriced asset or a hidden risk that comps aren't pricing in. Stress-test before assuming the spread holds.
Questions for listing agent
- What do current leases actually rent for vs. the listed asking? Can we see a recent rent roll and the last 12 months of T-12 income?
- Built in 1979 — when were the roof, HVAC, electrical panel, plumbing, and water heater last replaced?
- Is there a deadline driving the sale (1031 exchange, divorce, estate, relocation)? That informs how much negotiation room exists.
- Schools are D-rated, which usually means shorter tenancies and higher turnover. Who's the typical renter profile here, and what's been the actual vacancy rate?
- Crime grade is F in this area — have there been break-ins, vandalism, or insurance claims at this property in the last 3 years? What carrier currently insures it and at what premium?
- The area grade is low — what's the realistic commute time and amenity access for the typical tenant pool here? Any planned neighborhood developments (good or bad) we should know about?
- What's the average days-on-market for RENTAL listings here right now (not sales)? A rising rental-DOM trend means longer vacancies and softer asking-rent achievability than the comps imply.
- What's the recent tenant-quality profile in this submarket — average credit score on applications, eviction rate, late-payment / NSF rate, and stable-employment percentage? A property-management company in the area should have these aggregated.
CashFlowRE · CFR-QP1HKA5A69M7P9
· Data 4 weeks ago
cashflowre.app · 2026-05-29