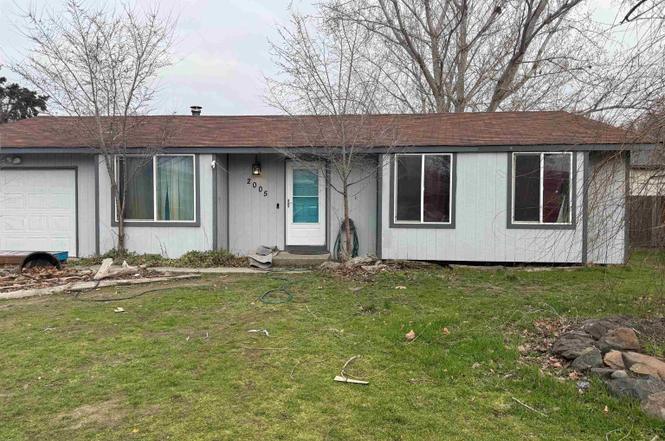
2005 S Tacoma St · Kennewick, WA
Flood risk 1/10 · Minimal
- FEMA flood zone
- X
- Chance of flooding over 30 yrs
- 0.0%
- Est. flood insurance / yr
- $507 – $1,088
Fire risk 2/10 · Minimal
- Est. fire insurance / yr
- $604 – $1,122
Heat risk 4/10 · Minor
- Hot days now (above 97°F)
- 7 days/yr
- Hot days in 30 yrs
- 14 days/yr
Wind risk 1/10 · Minimal
- Chance of severe wind over 30 yrs
- —
Air-quality risk 8/10 · Major
- Unhealthy air days now
- 15 days/yr
- Unhealthy air days in 30 yrs
- 16 days/yr
Risk factors via First Street. Map © Google.
Why this score? — see what drove the D grade
The composite is a weighted blend of 9 inputs, each scored 0–100. Each bar is that input's sub-score; the figure is the points it added to the 100-point composite (weight × sub-score).
- ARV discount +15.0/15.0
- Cash flow +8.9/30.0
- Schools +4.6/10.0
- Livability +3.9/5.0
- DSCR +2.5/10.0
- Rent growth +2.5/5.0
- Condition / age +2.5/5.0
- 1% rule +2.0/10.0
- Appreciation +0.0/10.0
$258,900
🖨 Deal sheet (PDF) 📄 Offer letter ✓ Due diligence
Listing remarks MLS
- Welcome Home! - This rambler home has 4 bedrooms, 2 baths. -Vaulted ceilings makes it feel spacious, kitchen has tile counters, floating shelf from ceiling and plenty of cupboards with additional dry storage area. - Beautiful laminate flooring in the living room area, slider that goes out to the nice back yard with fully enclosed fencing & A shed for your tools. - Spacious master bedroom also has laminate flooring & master bath. -Come and see this home today!
Key facts
- 0.24 acre lot
- Garage
- Built 1979
Neighborhood map
What this means for you Summary
Snapshot
- This is a 3-bed/2.0-bath single-family listed at $259k.
Deal economics
- At list price, monthly cash flow is $-207 ($-2k/yr) — negative.
- To cash-flow at today's rent, offer at most $222k (14.1% below list).
- To meet the 1% rule (rent ≥ 1% of price), the offer needs to be $182k (29.7% below list).
- Recommended offer: $182k (29.7% below list) — sets the bar for 1% rule.
- Cap rate 5.3% vs local median 3.3% in Kennewick — top-decile yield for the area; either an underpriced asset or a hidden risk that comps aren't pricing in. Stress-test before assuming the spread holds.
Location & tenants
- Location reads 78/100 on livability (#131 in WA, #2,599 nationally) — a middle-class / working-renter tenant base. Strengths: commute A+, housing A+, health & safety A; Watch: amenities D+, crime F.
- Kennewick School District (urban): math 43% / reading 58% proficiency, ranked #141 of 291 in WA (top 48%) — acceptable for families but not a draw, mixed tenant base, ~2y average lease.
- Zoned schools: Canyon View Elementary School (406 students, 68% FRL); Horse Heaven Hills Middle School (833 students, 65% FRL); Southridge High School (1,641 students, 55% FRL).
- Market conditions: 249 active listings in the ZIP; 40 comparable units currently listed for rent nearby; rentals at typical pace (median 23d on market — plan ~3-4 weeks tenant-placement turnaround); solid renter incomes; 1,532 units permitted in Benton County in 2024 (389 in 5+ unit buildings).
Forward outlook
- Local home prices are declining (-3.0%/yr); year-one equity from $2k of loan paydown is wiped out by about $8k of value loss. Plan a longer hold.
- Benton County population projected at +32% by 2050 — long-run rental-demand tailwind backs the buy-and-hold thesis.
Negotiation context
- It's been on market 22 days — a 2% lower offer ($255k) is reasonable based on typical stale-listing flexibility.
- 3 sale attempts since 23y ago with the ask held roughly flat each time — persistent listings suggest the price (not the market) is what's stuck; bring a comps-based counter.
Questions for the listing agent
- What do current leases actually rent for vs. the listed asking? Can we see a recent rent roll and the last 12 months of T-12 income?
- Built in 1979 — when were the roof, HVAC, electrical panel, plumbing, and water heater last replaced?
- Is there a deadline driving the sale (1031 exchange, divorce, estate, relocation)? That informs how much negotiation room exists.
- Schools are D-rated, which usually means shorter tenancies and higher turnover. Who's the typical renter profile here, and what's been the actual vacancy rate?
- Crime grade is F in this area — have there been break-ins, vandalism, or insurance claims at this property in the last 3 years? What carrier currently insures it and at what premium?
- The area grade is low — what's the realistic commute time and amenity access for the typical tenant pool here? Any planned neighborhood developments (good or bad) we should know about?
- What's the average days-on-market for RENTAL listings here right now (not sales)? A rising rental-DOM trend means longer vacancies and softer asking-rent achievability than the comps imply.
- What's the recent tenant-quality profile in this submarket — average credit score on applications, eviction rate, late-payment / NSF rate, and stable-employment percentage? A property-management company in the area should have these aggregated.
- How much new for-sale + rental construction is in the pipeline within 1–3 miles? Heavy new supply typically softens prices + rents 12–24 months out; constrained supply supports both.
Investment metrics
- 1% rule
- 0.70% ✗
- Cap rate
- 5.33%
- Cash-on-cash
- -3.42%
- DSCR
- 0.85
- GRM
- 11.9
CMA / ARV
- ARV (on-the-fly)
- $339,808
- Comps found
- 12
Show comp detail 12 sales within ~0.75 mi
| Address | Dist | Beds/Ba | Sqft | Sold | Price | $/sf | Match |
|---|---|---|---|---|---|---|---|
| 2411 S Vancouver St | 0.24mi | 3/2.0 | 1,180 (-0%) | 14mo | $339,000 | $287 | 76 |
| 1707 W 19th Ave | 0.21mi | 2/2.0 (-1) | 1,168 (-1%) | 10mo | $355,000 | $304 | 74 |
| 1871 W 25th Ct | 0.36mi | 3/2.0 | 1,235 (+4%) | 10mo | $378,000 | $306 | 68 |
| 2370 W 23rd Ave | 0.33mi | 3/2.0 | 1,244 (+5%) | 18mo | $350,000 | $281 | 61 |
| 1520 W 15th Ave | 0.42mi | 3/2.0 | 1,216 (+3%) | 20mo | $372,900 | $307 | 60 |
| 2906 S Waverly St | 0.58mi | 3/2.0 | 1,157 (-2%) | 12mo | $359,900 | $311 | 59 |
| 1812 S Rainier Pl | 0.21mi | 3/1.5 | 1,356 (+14%) | 8mo | $359,900 | $265 | 57 |
| 2903 S Yelm St | 0.56mi | 3/2.0 | 1,242 (+5%) | 11mo | $335,000 | $270 | 57 |
| 1720 W 11th Ave | 0.55mi | 3/1.5 | 1,300 (+10%) | 1mo | $289,000 | $222 | 55 |
| 1958 W 15th Pl | 0.28mi | 3/1.0 | 1,338 (+13%) | 13mo | $300,000 | $224 | 50 |
| 1719 S Zillah St | 0.28mi | 3/1.0 | 1,048 (-12%) | 20mo | $315,000 | $301 | 47 |
| 3011 S Yelm St | 0.66mi | 3/2.0 | 1,326 (+12%) | 5mo | $340,000 | $256 | 45 |
Match score weights: distance 35% · size 25% · config 20% · recency 20%. Top-matched comps best support the ARV.
Projected returns pro-forma
-3.0% appreciation · 3.0% rent growth · sell at horizon
- IRR
- -22.1%
- Equity multiple
- 0.24×
- Total profit
- $-55,192
- Equity at exit
- $38,603
- IRR
- -16.1%
- Equity multiple
- 0.10×
- Total profit
- $-65,278
- Equity at exit
- $22,385
Cash invested: $72,492 (down + closing). Projections, not guarantees.
Landlord ↔ Tenant lean methodology
- Overall (STATE)
- 28 Tenant-Leaning
- State Washington
- 28 Tenant-Leaning · D+8
- County
- — inherits STATE
- City
- — inherits STATE
ZIP-level market 99337
- Active inventory
- 249
- Price-to-rent
- 11.9×
Monthly cashflow live
- Estimated rent
- $1,820 high interval (Pro) →
- Mortgage (P&I)
- −$1,358
- Tax from tax record
- −$179 /mo · $2,147/yr
- Insurance
- −$108
- HOA
- −$0
- Vacancy / Maint / Mgmt
- −$382
- Net cashflow
- $-207
Break-even live
Sensitivity live
| Price | -10% $-60 | -5% $-134 | +0% $-207 | +5% $-280 | +10% $-353 |
|---|---|---|---|---|---|
| Rent | -10% $-351 | -5% $-279 | +0% $-207 | +5% $-135 | +10% $-63 |
| Rate | -1.0pp $-77 | -0.5pp $-141 | base $-207 | +0.5pp $-274 | +1.0pp $-342 |
UW: 25.0% down · 7.5% · 30yr · 1.5% tax · 5.0% vac · 8.0% maint · 8.0% mgmt
Financing live
Cash to close
- Down payment
- $64,725
- Closing costs
- $7,767
- Reserves months
- —
- Total cash needed
- —
Loan-product check · same deal, 3 products live
Conventional
25% down · 7.5% · 30yr
- Down + closing
- —
- Monthly P&I
- —
- Monthly cashflow
- —
- DSCR
- —
- Eligible?
- —
Personal DTI + credit; lowest rate.
DSCR
20% down · 8.5% · 30yr
- Down + closing
- —
- Monthly P&I
- —
- Monthly cashflow
- —
- DSCR
- —
- Eligible?
- —
No personal income docs; deal must DSCR.
Hard money
10% down · 12.0% · 12mo
- Down + closing
- —
- Monthly P&I
- —
- Monthly cashflow
- —
- DSCR
- —
- Eligible?
- —
Short-term bridge; refi at stabilization.
Rent comps 40 comps
| Address | Beds | Baths | Sqft | Rent | $/sqft | DOM | Units | Dist |
|---|---|---|---|---|---|---|---|---|
| 1816 W 21st Ave Unit C Kennewick, WA | 3.0 | 2.0 | 1120 | $1,495 | $1.33 | 15d | 1 | 0.02mi |
| 1863 W 19th Ave Unit 1863-B240 Kennewick, WA | 3.0 | 2.0 | 1200 | $1,750 | $1.46 | 23d | 1 | 0.07mi |
| 1923 S Vancouver St Kennewick, WA | 3.0 | 2.0 | 1200 | $2,022 | $1.69 | 15d | 3 | 0.08mi |
| 1608 W 14th Ave Unit 1614 Kennewick, WA | 2.0 | 1.0 | 750 | $995 | $1.33 | 23d | 1 | 0.46mi |
| 1163 S Underwood Pl #110 Kennewick, WA | 3.0 | 2.5 | 1478 | $2,395 | $1.62 | 45d | 1 | 0.51mi |
| 1701 W 30th Ave Kennewick, WA | 3.0 | 2.0 | 1500 | $2,195 | $1.46 | 15d | 1 | 0.64mi |
| 2652 W 15th Ave Kennewick, WA | 2.0–3.0 | 2.0 | 1152 | $1,899 | $1.65 | 15d | 5 | 0.67mi |
| 1110 S Newport St Unit 1110ne B Kennewick, WA | 2.0 | 2.0 | 995 | $1,300 | $1.31 | 45d | 1 | 0.69mi |
| 1105 W 10th Ave Kennewick, WA | 1.0–2.0 | 1.0 | 687 | $1,306 | $1.90 | 15d | 8 | 0.78mi |
| 1618 W 7th Pl Unit A Kennewick, WA | 2.0 | 1.0 | 920 | $1,050 | $1.14 | 45d | 1 | 0.85mi |
| 1702 W 7th Pl Unit B Kennewick, WA | 2.0 | 1.0 | 950 | $1,050 | $1.11 | 45d | 1 | 0.85mi |
| 1114 W 10th Ave Kennewick, WA | 3.0 | 1.0–2.0 | 829 | $1,551 | $1.87 | 15d | 41 | 0.91mi |
| 1619 W 5th Ave Unit A Kennewick, WA | 2.0 | 1.0 | 981 | $1,450 | $1.48 | 23d | 1 | 0.97mi |
| 1107 W 5th Ave Kennewick, WA | 2.0 | 1.0 | 850 | $1,588 | $1.87 | 15d | 2 | 0.99mi |
| 513 S Anderson St Kennewick, WA | 2.0 | 1.0 | 720 | $1,495 | $2.08 | 23d | 1 | 0.99mi |
| 505 S Olympia St Unit 1326 K3 Kennewick, WA | 3.0 | 1.0 | 945 | $1,650 | $1.75 | 23d | 1 | 1.00mi |
| 505 S Olympia St Apt H1 Kennewick, WA | 3.0 | 1.0 | 890 | $1,675 | $1.88 | 45d | 1 | 1.00mi |
| 601 S Kent St Unit 601 K203 Kennewick, WA | 2.0 | 1.0 | 867 | $1,300 | $1.50 | 45d | 1 | 1.07mi |
| 601 S Kent St Unit 601 C202 Kennewick, WA | 2.0 | 1.0 | 867 | $1,300 | $1.50 | 23d | 1 | 1.07mi |
| 601 S Kent St Unit 601 F205 Kennewick, WA | 2.0 | 1.0 | 867 | $1,275 | $1.47 | 15d | 1 | 1.07mi |
| 425 S Olympia St Kennewick, WA | 2.0 | 1.0–2.0 | 1000 | $1,335 | $1.33 | 15d | 9 | 1.09mi |
| 500 S Conway Pl Unit 500 Kennewick, WA | 2.0 | 1.0 | 950 | $1,500 | $1.58 | 45d | 1 | 1.10mi |
| 705 S Ione St Kennewick, WA | 3.0 | 1.5 | 1056 | $2,000 | $1.89 | 15d | 1 | 1.15mi |
| 1000 W 5th Ave Kennewick, WA | 3.0–4.0 | 2.0 | 1157 | $1,371 | $1.18 | 15d | 4 | 1.16mi |
| 3611 W 17th Pl Unit A Kennewick, WA | 2.0 | 1.0 | 970 | $1,495 | $1.54 | 23d | 1 | 1.18mi |
| 3613 W 16th Pl Unit B Kennewick, WA | 2.0 | 1.5 | 1170 | $1,295 | $1.11 | 45d | 1 | 1.18mi |
| 1915 S Neel St Kennewick, WA | 3.0 | 2.0 | 1401 | $3,000 | $2.14 | 15d | 1 | 1.19mi |
| 3113 W 7th Ave Unit D110 Kennewick, WA | 2.0 | 2.5 | 1000 | $1,750 | $1.75 | 15d | 1 | 1.19mi |
| 3119 W 7th Ave Kennewick, WA | 3.0 | 2.5 | 1500 | $2,050 | $1.37 | 15d | 1 | 1.22mi |
| 3119 W 7th Ave Unit C120 Kennewick, WA | 3.0 | 2.5 | 1500 | $2,050 | $1.37 | 23d | 1 | 1.22mi |
| 3320 W 9th Ave Unit 30 Kennewick, WA | 2.0 | 2.0 | 1200 | $1,400 | $1.17 | 45d | 1 | 1.31mi |
| 130 S Conway Pl Kennewick, WA | 2.0 | 1.0 | 852 | $1,299 | $1.52 | 15d | 1 | 1.34mi |
| 119 S Conway Pl Kennewick, WA | 2.0 | 1.0 | 711 | $1,200 | $1.69 | 23d | 1 | 1.39mi |
| 3426 W 7th Ave Kennewick, WA | 2.0 | 2.0 | 1000 | $1,600 | $1.60 | 23d | 1 | 1.39mi |
| 3426 W 7th Ave Unit A130 Kennewick, WA | 2.0 | 2.0 | 1000 | $1,650 | $1.65 | 45d | 1 | 1.39mi |
| 17 W 24th Ave Unit B1 Kennewick, WA | 2.0 | 1.0 | 770 | $1,200 | $1.56 | 45d | 1 | 1.39mi |
| 89 N Waverly Pl Apt E Kennewick, WA | 2.0 | 1.0 | 1000 | $1,250 | $1.25 | 45d | 1 | 1.42mi |
| 4112 W 24th Ave Kennewick, WA | 1.0–2.0 | 1.0–2.0 | 681 | $1,875 | $2.75 | 23d | 4 | 1.45mi |
| 3120 W 4th Ave Apt 120 Kennewick, WA | 2.0 | 1.0 | 963 | $1,625 | $1.69 | 15d | 1 | 1.45mi |
| 3120 W 4th Ave Unit 360 Kennewick, WA | 2.0 | 1.0 | 963 | $1,550 | $1.61 | 45d | 1 | 1.45mi |
Listing history 7 events
-
2026-03-12status Pending
-
2026-02-18$258,900 Active
-
2020-07-10soldstatus $234,900 479-char remark
Show marketing remark (479 chars)
- Welcome Home! - This rambler home has 4 bedrooms, 2 baths. -Vaulted ceilings makes it feel spacious, kitchen has tile counters, floating shelf from ceiling and plenty of cupboards with additional dry storage area. - Beautiful laminate flooring in the living room area, slider that goes out to the nice back yard with fully enclosed fencing & A shed for your tools. - Spacious master bedroom also has laminate flooring & master bath. -Come and see this home today!
-
2020-05-20$234,900 479-char remark
Show marketing remark (479 chars)
- Welcome Home! - This rambler home has 4 bedrooms, 2 baths. -Vaulted ceilings makes it feel spacious, kitchen has tile counters, floating shelf from ceiling and plenty of cupboards with additional dry storage area. - Beautiful laminate flooring in the living room area, slider that goes out to the nice back yard with fully enclosed fencing & A shed for your tools. - Spacious master bedroom also has laminate flooring & master bath. -Come and see this home today!
-
2003-11-07soldstatus $108,000 69-char remark
Show marketing remark (69 chars)
NEW PAINT INSIDE & OUT. FOR MORE INFORMATION CALL 800-321-1337!
-
2003-11-07soldstatus $108,000
Show marketing remark (69 chars)
NEW PAINT INSIDE & OUT. FOR MORE INFORMATION CALL 800-321-1337!
-
2003-06-30$110,000 69-char remark
Show marketing remark (69 chars)
NEW PAINT INSIDE & OUT. FOR MORE INFORMATION CALL 800-321-1337!
ⓘ Source: listings_history table (triggers on properties + properties_extension) + one-shot
backfill from property_details.listing_events for pre-trigger history.
Tax reassessment forecast WA · Resets to sale price
- Current annual tax
- $2,147 · $179/mo
- Projected year-2 tax
- $2,537 · $211/mo
- Expected delta
- +$391/yr (+$33/mo · 18.2%)
ⓘ Screening estimate from a state-policy table — verify with the county assessor before closing.
Climate risk First Street
- Flood 1/10 Low FEMA zone X · 0% chance over 30 yrs
- Wildfire 2/10 Low
- Heat 4/10 Moderate 7 d/yr ≥97°F today · 14 d/yr by 30 yrs out
- Wind 1/10 Low
- Air quality 8/10 Severe 15 unhealthy d/yr today · 16 by 30 yrs out
Nearby sold comps map
Loading sold comps map…
Walkable amenities ~0.75 mi
Loading nearby amenities…
Taxation est. · year 1
- Rental income
- $21,836
- − Mortgage interest
- −$14,502
- − Property taxes
- −$2,147
- − Insurance
- −$1,294
- − Repairs & maintenance
- −$1,747
- − Management
- −$1,747
- − Depreciation
- −$7,532
- Taxable loss
- −$7,133
- Est. tax savings @ 24.0%
- +$1,712
- After-tax cash flow
- $-771/yr
For passive investors: Depreciation is non-cash, so a rental often shows a tax loss while cash-flowing — sheltering income. Rental losses are passive: they offset passive income freely, and up to $25,000/yr can offset ordinary (W-2) income if you actively participate and your MAGI is under $100k (phasing out to $0 by $150k); unused losses carry forward. On sale, claimed depreciation is recaptured at up to 25%, and gains may owe capital-gains tax (a 1031 exchange can defer both). Figures are a year-1 estimate at your 24.0% rate — not tax advice; consult a CPA.
Schools (NCES district)
- District
- Kennewick School District
- NCES district ID
- 5303930
- Math proficiency
- 43% ▼ -1.00%
- Reading proficiency
- 58% ▬ 0.00%
- Median HH income
- $54,191
- Composite
- 45.56/100
- National rank
- #5667
- State rank
- #141 of 291 in WA
Livability — Kennewick
- Score
- 78/100
- State rank
- #131
- US rank
- #2599
Category grades
Schools grade is shown separately in the Schools card above.
Census & demographics
- Census place
- Kennewick, WA
- County
- Benton County · 186,895 people
- City population
- 104,655
- Metro
- Kennewick-Richland, WA
- Population (ZIP)
- 33,287
- Household income
- $98,848
- Rent vs Own
- Severe rent burden
- 430.0
Population outlook (Benton County) Hauer SSP2
- Today (2025)
- 219,421 people
- By 2030
- 233,813 · +6.6%
- By 2040
- 262,134 · +19.5%
- By 2050
- 290,100 · +32.2%
- By 2075
- 363,525 · +65.7%
- By 2100
- 418,667 · +90.8%
Race, ethnicity, and origin ACS 2023
- Neighborhood character
- Predominantly White (67%)
- Race & ethnicity
- White 67% Hispanic / Latino 26% Two or more races 13% Asian 1% Black 1%
- Hispanic origin (detail)
- Mexican 24%
- Common ancestry
- Lithuanian 4% Portuguese 3% Iranian 2%
- Foreign-born
- 12% · Canada, Vietnam
- Languages at home
- 76% English-only · Spanish 20% Russian/Polish/Slavic 2%
Political lean MEDSL · Benton
- 2024 margin
- Strong R (+21.9) · D 37.7% · R 59.6% · Other 2.7%
- 2008→2024 swing
- +4.2pp toward D · 2008: -26.1pp · 2024: -21.9pp
- All cycles
- 2024: R+21.9 2020: R+21.0 2016: R+26.6 2012: R+27.0 2008: R+26.1
Not yet ingested
- Civics
- —
Market trends
- HPI YoY
- ▼ -260.38%
- Current HPI
- 245.5375
- Rent YoY
- —
- Metro
- Kennewick-Richland, WA
- State GDP YoY
- ▲ 4.65%
- F500 in state
- 22
Industry mix (Fortune 500 HQ in WA)
| Industry | F500 HQs | Revenue |
|---|---|---|
| Retail | 2 | $269B |
|
||
| Technology / Retail | 1 | $638B |
|
||
| Technology | 1 | $245B |
|
||
| Telecommunications | 1 | $38B |
|
||
| Food / Beverage | 1 | $36B |
|
||
| Automotive / Trucks | 1 | $34B |
|
||
Price history
+135.4% since first listed7 events — show timeline
- 2026-03-12 Pending — PACMLS
- 2026-02-18 Listed $258,900 PACMLS
- 2020-07-10 Sold (MLS) $234,900 PACMLS
- 2020-05-20 Listed $234,900 PACMLS
- 2003-11-07 Sold (Public Records) $108,000 Public Records
- 2003-11-07 Sold (MLS) $108,000 PACMLS
- 2003-06-30 Listed $110,000 PACMLS
Property tax history
+4.0%/yrLatest (2026): $2,147 · -5.6% YoY. Source: county tax records.
Cash-flow waterfall
monthlySold comps — $/sqft
last 12 mo · ≤1 miLoading sold comps…